HP 2014 Annual Report Download - page 128
Download and view the complete annual report
Please find page 128 of the 2014 HP annual report below. You can navigate through the pages in the report by either clicking on the pages listed below, or by using the keyword search tool below to find specific information within the annual report.-
 1
1 -
2
-
3
-
4
-
5
-
6
-
7
-
8
-
9
-
10
-
11
-
12
-
13
-
14
-
15
-
16
-
17
-
18
-
19
-
20
-
21
-
22
-
23
-
24
-
25
-
26
-
27
-
28
-
29
-
30
-
31
-
32
-
33
-
34
-
35
-
36
-
37
-
38
-
39
-
40
-
41
-
42
-
43
-
44
-
45
-
46
-
47
-
48
-
49
-
50
-
51
-
52
-
53
-
54
-
55
-
56
-
57
-
58
-
59
-
60
-
61
-
62
-
63
-
64
-
65
-
66
-
67
-
68
-
69
-
70
-
71
-
72
-
73
-
74
-
75
-
76
-
77
-
78
-
79
-
80
-
81
-
82
-
83
-
84
-
85
-
86
-
87
-
88
-
89
-
90
-
91
-
92
-
93
-
94
-
95
-
96
-
97
-
98
-
99
-
100
-
101
-
102
-
103
-
104
-
105
-
106
-
107
-
108
-
109
-
110
-
111
-
112
-
113
-
114
-
115
-
116
-
117
-
 118
118 -
 119
119 -
 120
120 -
 121
121 -
 122
122 -
 123
123 -
 124
124 -
 125
125 -
 126
126 -
 127
127 -
 128
128 -
 129
129 -
 130
130 -
 131
131 -
 132
132 -
 133
133 -
 134
134 -
 135
135 -
 136
136 -
 137
137 -
 138
138 -
139
-
140
-
141
-
142
-
143
-
144
-
145
-
146
-
147
-
148
-
149
-
150
-
151
-
152
-
153
-
154
-
155
-
156
-
157
-
158
-
159
-
160
-
161
-
162
-
163
-
164
-
165
-
166
-
167
-
168
-
169
-
170
-
171
-
172
-
173
-
174
-
175
-
176
-
177
-
178
-
179
-
180
-
181
-
182
-
183
-
184
-
185
-
186
-
187
-
188
-
189
-
190
-
191
-
192
-
193
-
194
-
195
-
196
 |
 |

HEWLETT-PACKARD COMPANY AND SUBSIDIARIES
Notes to Consolidated Financial Statements (Continued)
Note 5: Stock-Based Compensation (Continued)
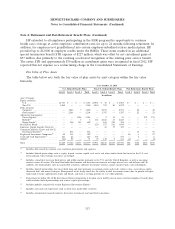
volatility for all awards was estimated using the implied volatility derived from options traded on
HP’s common stock.
(3) The risk-free interest rate was estimated based on the yield on U.S. Treasury zero-coupon issues.
(4) The expected dividend yield represents a constant dividend yield applied for the duration of the
expected term of the award.
(5) For awards subject to service-based vesting, the expected term was estimated using historical
exercise and post-vesting termination patterns; and for performance-contingent awards, the
expected term represents an output from the lattice model.
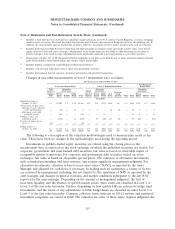
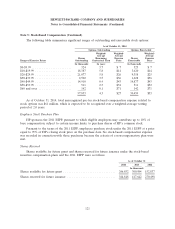
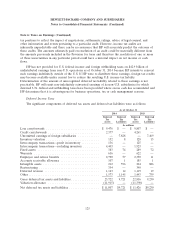
A summary of stock option activity is as follows:
As of October 31
2014 2013 2012
Weighted- Weighted- Weighted-
Weighted- Average Weighted- Average Weighted- Average
Average Remaining Aggregate Average Remaining Aggregate Average Remaining Aggregate
Exercise Contractual Intrinsic Exercise Contractual Intrinsic Exercise Contractual Intrinsic
Shares Price Term Value Shares Price Term Value Shares Price Term Value
In thousands In years In millions In thousands In years In millions In thousands In years In millions
Outstanding at
beginning of year . . . 84,042 $27 87,296 $29 120,243 $28
Granted . . . ...... 9,575 $28 25,785 $15 7,529 $27
Exercised . . . . . . . . (11,145) $18 (10,063) $19 (29,683) $20
Forfeited/cancelled/
expired . . . . . . . . (24,619) $31 (18,976) $25 (10,793) $35
Outstanding at end of
year . . . ...... 57,853 $27 4.3 $629 84,042 $27 3.9 $303 87,296 $29 3.0 $15
Vested and expected to
vest at end of year . . 54,166 $27 4.1 $571 80,004 $27 3.7 $274 85,935 $29 2.9 $15
Exercisable at end of
year . . . ...... 30,459 $33 2.3 $197 49,825 $33 1.8 $ 58 68,437 $31 1.9 $12
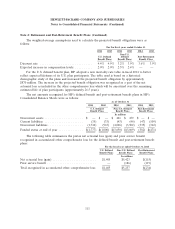
The aggregate intrinsic value in the table above represents the total pre-tax intrinsic value that
option holders would have received had all option holders exercised their options on the last trading
day of fiscal 2014, 2013 and 2012. The aggregate intrinsic value is the difference between HP’s closing
stock price on the last trading day of the fiscal year and the exercise price, multiplied by the number of
in-the-money options. The total intrinsic value of options exercised in fiscal 2014, 2013 and 2012 was
$151 million, $36 million and $176 million, respectively. The total grant date fair value of options
vested in fiscal 2014, 2013 and 2012 was $53 million, $64 million and $104 million, respectively, net of
taxes.
120