HP 2014 Annual Report Download - page 63
Download and view the complete annual report
Please find page 63 of the 2014 HP annual report below. You can navigate through the pages in the report by either clicking on the pages listed below, or by using the keyword search tool below to find specific information within the annual report.-
 1
1 -
2
-
3
-
4
-
5
-
6
-
7
-
8
-
9
-
10
-
11
-
12
-
13
-
14
-
15
-
16
-
17
-
18
-
19
-
20
-
21
-
22
-
23
-
24
-
25
-
26
-
27
-
28
-
29
-
30
-
31
-
32
-
33
-
34
-
35
-
36
-
37
-
38
-
39
-
40
-
41
-
42
-
43
-
44
-
45
-
46
-
47
-
48
-
49
-
50
-
51
-
52
-
 53
53 -
 54
54 -
 55
55 -
 56
56 -
 57
57 -
 58
58 -
 59
59 -
 60
60 -
 61
61 -
 62
62 -
 63
63 -
 64
64 -
 65
65 -
 66
66 -
 67
67 -
 68
68 -
 69
69 -
 70
70 -
 71
71 -
 72
72 -
 73
73 -
74
-
75
-
76
-
77
-
78
-
79
-
80
-
81
-
82
-
83
-
84
-
85
-
86
-
87
-
88
-
89
-
90
-
91
-
92
-
93
-
94
-
95
-
96
-
97
-
98
-
99
-
100
-
101
-
102
-
103
-
104
-
105
-
106
-
107
-
108
-
109
-
110
-
111
-
112
-
113
-
114
-
115
-
116
-
117
-
118
-
119
-
120
-
121
-
122
-
123
-
124
-
125
-
126
-
127
-
128
-
129
-
130
-
131
-
132
-
133
-
134
-
135
-
136
-
137
-
138
-
139
-
140
-
141
-
142
-
143
-
144
-
145
-
146
-
147
-
148
-
149
-
150
-
151
-
152
-
153
-
154
-
155
-
156
-
157
-
158
-
159
-
160
-
161
-
162
-
163
-
164
-
165
-
166
-
167
-
168
-
169
-
170
-
171
-
172
-
173
-
174
-
175
-
176
-
177
-
178
-
179
-
180
-
181
-
182
-
183
-
184
-
185
-
186
-
187
-
188
-
189
-
190
-
191
-
192
-
193
-
194
-
195
-
196
 |
 |

HEWLETT-PACKARD COMPANY AND SUBSIDIARIES
Management’s Discussion and Analysis of
Financial Condition and Results of Operations (Continued)
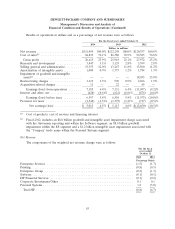
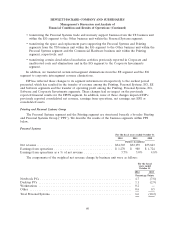
Results of operations in dollars and as a percentage of net revenue were as follows:
For the fiscal years ended October 31
2014 2013 2012
Dollars in millions
Net revenue ......................... $111,454 100.0% $112,298 100.0% $120,357 100.0%
Cost of sales(1) ....................... 84,839 76.1% 86,380 76.9% 92,385 76.8%
Gross profit ....................... 26,615 23.9% 25,918 23.1% 27,972 23.2%
Research and development .............. 3,447 3.1% 3,135 2.8% 3,399 2.8%
Selling, general and administrative ......... 13,353 12.0% 13,267 11.8% 13,500 11.2%
Amortization of intangible assets .......... 1,000 0.9% 1,373 1.2% 1,784 1.5%
Impairment of goodwill and intangible
assets(2) ........................... — — — — 18,035 15.0%
Restructuring charges .................. 1,619 1.5% 990 0.9% 2,266 1.9%
Acquisition-related charges .............. 11 — 22 — 45 —
Earnings (loss) from operations ....... 7,185 6.4% 7,131 6.4% (11,057) (9.2)%
Interest and other, net ................. (628) (0.6)% (621) (0.6)% (876) (0.8)%
Earnings (loss) before taxes .......... 6,557 5.8% 6,510 5.8% (11,933) (10.0)%
Provision for taxes .................... (1,544) (1.3)% (1,397) (1.2)% (717) (0.5)%
Net earnings (loss) ............... $ 5,013 4.5% $ 5,113 4.6% $(12,650) (10.5)%
(1) Cost of products, cost of services and financing interest.
(2) Fiscal 2012, includes an $8.8 billion goodwill and intangible asset impairment charge associated
with the Autonomy reporting unit within the Software segment, an $8.0 billion goodwill
impairment within the ES segment and a $1.2 billion intangible asset impairment associated with
the ‘‘Compaq’’ trade name within the Personal Systems segment.
Net Revenue
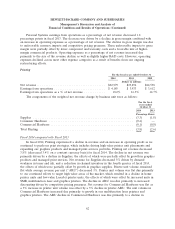
The components of the weighted net revenue change were as follows:
For the fiscal
years ended
October 31
2014 2013
Percentage Points
Enterprise Services ................................................. (1.5) (1.7)
Printing .......................................................... (0.8) (0.5)
Enterprise Group .................................................. (0.2) (1.3)
Software ......................................................... (0.1) (0.1)
HP Financial Services ............................................... (0.1) (0.2)
Corporate Investments/Other .......................................... 0.1 0.1
Personal Systems ................................................... 1.8 (3.0)
Total HP ....................................................... (0.8) (6.7)
55