HP 2014 Annual Report Download - page 70
Download and view the complete annual report
Please find page 70 of the 2014 HP annual report below. You can navigate through the pages in the report by either clicking on the pages listed below, or by using the keyword search tool below to find specific information within the annual report.-
 1
1 -
2
-
3
-
4
-
5
-
6
-
7
-
8
-
9
-
10
-
11
-
12
-
13
-
14
-
15
-
16
-
17
-
18
-
19
-
20
-
21
-
22
-
23
-
24
-
25
-
26
-
27
-
28
-
29
-
30
-
31
-
32
-
33
-
34
-
35
-
36
-
37
-
38
-
39
-
40
-
41
-
42
-
43
-
44
-
45
-
46
-
47
-
48
-
49
-
50
-
51
-
52
-
53
-
54
-
55
-
56
-
57
-
58
-
59
-
 60
60 -
 61
61 -
 62
62 -
 63
63 -
 64
64 -
 65
65 -
 66
66 -
 67
67 -
 68
68 -
 69
69 -
 70
70 -
 71
71 -
 72
72 -
 73
73 -
 74
74 -
 75
75 -
 76
76 -
 77
77 -
 78
78 -
 79
79 -
 80
80 -
81
-
82
-
83
-
84
-
85
-
86
-
87
-
88
-
89
-
90
-
91
-
92
-
93
-
94
-
95
-
96
-
97
-
98
-
99
-
100
-
101
-
102
-
103
-
104
-
105
-
106
-
107
-
108
-
109
-
110
-
111
-
112
-
113
-
114
-
115
-
116
-
117
-
118
-
119
-
120
-
121
-
122
-
123
-
124
-
125
-
126
-
127
-
128
-
129
-
130
-
131
-
132
-
133
-
134
-
135
-
136
-
137
-
138
-
139
-
140
-
141
-
142
-
143
-
144
-
145
-
146
-
147
-
148
-
149
-
150
-
151
-
152
-
153
-
154
-
155
-
156
-
157
-
158
-
159
-
160
-
161
-
162
-
163
-
164
-
165
-
166
-
167
-
168
-
169
-
170
-
171
-
172
-
173
-
174
-
175
-
176
-
177
-
178
-
179
-
180
-
181
-
182
-
183
-
184
-
185
-
186
-
187
-
188
-
189
-
190
-
191
-
192
-
193
-
194
-
195
-
196
 |
 |

HEWLETT-PACKARD COMPANY AND SUBSIDIARIES
Management’s Discussion and Analysis of
Financial Condition and Results of Operations (Continued)
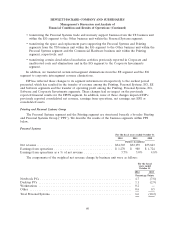
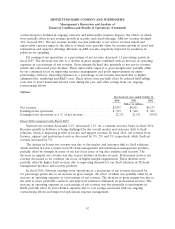
Personal Systems earnings from operations as a percentage of net revenue decreased 1.8
percentage points in fiscal 2013. The decrease was driven by a decline in gross margin combined with
an increase in operating expenses as a percentage of net revenue. The decline in gross margin was due
to unfavorable currency impacts and competitive pricing pressures. These unfavorable impacts to gross
margin were partially offset by lower component and warranty costs and a favorable mix of higher-
margin commercial products. Operating expenses as a percentage of net revenue increased due
primarily to the size of the revenue decline as well as slightly higher R&D costs. However, operating
expenses declined across most other expense categories as a result of benefits from our ongoing
restructuring efforts.
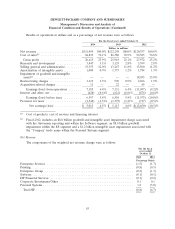
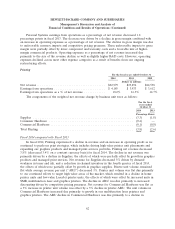
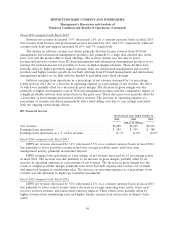
Printing
For the fiscal years ended October 31
2014 2013 2012
Dollars in millions
Net revenue ....................................... $22,979 $23,896 $24,538
Earnings from operations ............................. $ 4,185 $ 3,933 $ 3,612
Earnings from operations as a % of net revenue ............ 18.2% 16.5% 14.7%
The components of the weighted net revenue change by business unit were as follows:
For the fiscal
years ended
October 31
2014 2013
Percentage Points
Supplies ......................................................... (3.3) (1.8)
Consumer Hardware ................................................ (0.4) —
Commercial Hardware ............................................... (0.1) (0.8)
Total Printing ..................................................... (3.8) (2.6)
Fiscal 2014 compared with Fiscal 2013
In fiscal 2014, Printing experienced a decline in revenue and an increase in operating profit as we
continued to push our print strategies, which includes driving high value printer unit placements and
expanding our graphics products and managed print services portfolio. Printing net revenue decreased
3.8% (decreased 3.4% on a constant currency basis) for fiscal 2014. The decline in net revenue was
primarily driven by a decline in Supplies, the effects of which were partially offset by growth in graphics
products and managed print services. Net revenue for Supplies decreased 5% driven by demand
weakness in toner and ink, and a reduction in channel inventory in the fourth quarter of fiscal 2014,
the effects of which were partially offset by growth in graphics supplies. Printer unit volume remained
flat while average revenue per unit (‘‘ARU’’) decreased 1%. Printer unit volume was flat due primarily
to our continued efforts to target high value areas of the market, which resulted in a decline in home
printer units and low-value LaserJet printer units, the effects of which were offset by increased units in
SMB, multifunction laser and graphics printers. The decline in ARU was due primarily to increased
discounting driven by competitive pricing pressures. Net revenue for Commercial Hardware was flat as
a 3% increase in printer unit volume was offset by a 3% decline in printer ARU. The unit volume in
Commercial Hardware increased due primarily to growth in our multifunction laser printers and
graphics printers. The ARU decline in Commercial Hardware was due primarily to a decline in
62