HP 2014 Annual Report Download - page 58
Download and view the complete annual report
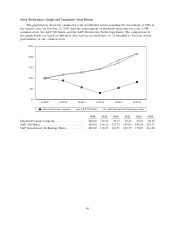
Please find page 58 of the 2014 HP annual report below. You can navigate through the pages in the report by either clicking on the pages listed below, or by using the keyword search tool below to find specific information within the annual report.-
 1
1 -
2
-
3
-
4
-
5
-
6
-
7
-
8
-
9
-
10
-
11
-
12
-
13
-
14
-
15
-
16
-
17
-
18
-
19
-
20
-
21
-
22
-
23
-
24
-
25
-
26
-
27
-
28
-
29
-
30
-
31
-
32
-
33
-
34
-
35
-
36
-
37
-
38
-
39
-
40
-
41
-
42
-
43
-
44
-
45
-
46
-
47
-
 48
48 -
 49
49 -
 50
50 -
 51
51 -
 52
52 -
 53
53 -
 54
54 -
 55
55 -
 56
56 -
 57
57 -
 58
58 -
 59
59 -
 60
60 -
 61
61 -
 62
62 -
 63
63 -
 64
64 -
 65
65 -
 66
66 -
 67
67 -
 68
68 -
69
-
70
-
71
-
72
-
73
-
74
-
75
-
76
-
77
-
78
-
79
-
80
-
81
-
82
-
83
-
84
-
85
-
86
-
87
-
88
-
89
-
90
-
91
-
92
-
93
-
94
-
95
-
96
-
97
-
98
-
99
-
100
-
101
-
102
-
103
-
104
-
105
-
106
-
107
-
108
-
109
-
110
-
111
-
112
-
113
-
114
-
115
-
116
-
117
-
118
-
119
-
120
-
121
-
122
-
123
-
124
-
125
-
126
-
127
-
128
-
129
-
130
-
131
-
132
-
133
-
134
-
135
-
136
-
137
-
138
-
139
-
140
-
141
-
142
-
143
-
144
-
145
-
146
-
147
-
148
-
149
-
150
-
151
-
152
-
153
-
154
-
155
-
156
-
157
-
158
-
159
-
160
-
161
-
162
-
163
-
164
-
165
-
166
-
167
-
168
-
169
-
170
-
171
-
172
-
173
-
174
-
175
-
176
-
177
-
178
-
179
-
180
-
181
-
182
-
183
-
184
-
185
-
186
-
187
-
188
-
189
-
190
-
191
-
192
-
193
-
194
-
195
-
196
 |
 |

HEWLETT-PACKARD COMPANY AND SUBSIDIARIES
Management’s Discussion and Analysis of
Financial Condition and Results of Operations (Continued)
expected increase in the compensation levels assumption reflects our long-term actual experience and
future expectations. The expected long-term return on plan assets is determined based on asset
allocations, historical portfolio results, historical asset correlations and management’s expected returns
for each asset class. In any fiscal year, significant differences may arise between the actual return and
the expected long-term return on plan assets. Historically, differences between the actual return and
expected long-term return on plan assets have resulted from changes in target or actual asset
allocation, short-term performance relative to expected long-term performance, and to a lesser extent,
differences between target and actual investment allocations, the timing of benefit payments compared
to expectations, and the use of derivatives intended to effect asset allocation changes or hedge certain
investment or liability exposures. For the recognition of net periodic benefit cost, the calculation of the
expected long-term return on plan assets uses the fair value of plan assets as of the beginning of the
fiscal year.
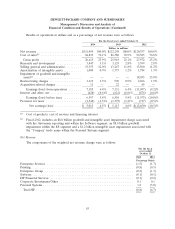
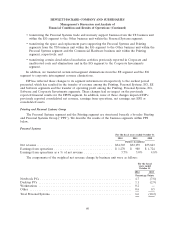
Our major assumptions vary by plan, and the weighted-average rates used are set forth in Note 4
to the Consolidated Financial Statements in Item 8, which is incorporated herein by reference. The
following table provides the impact changes in the weighted-average assumptions of discount rates, the
expected increase in compensation levels and the expected long-term return on plan assets would have
had on our net periodic benefit cost for fiscal 2014:
Change in
Net Periodic
Change in Benefit Cost
percentage points in millions
Assumptions:
Discount rate ........................................... (25) $83
Expected increase in compensation levels ....................... 25 $20
Expected long-term return on plan assets ....................... (25) $68
Taxes on Earnings
We calculate our current and deferred tax provisions based on estimates and assumptions that
could differ from the final positions reflected in our income tax returns. We adjust our current and
deferred tax provisions based on income tax returns which are generally filed in the third or fourth
quarters of the subsequent fiscal year.
We recognize deferred tax assets and liabilities for the expected tax consequences of temporary
differences between the tax bases of assets and liabilities and their reported amounts using enacted tax
rates in effect for the year in which we expect the differences to reverse.
We record a valuation allowance to reduce deferred tax assets to the amount that we are more
likely than not to realize. In determining the need for a valuation allowance, we consider future market
growth, forecasted earnings, future taxable income, the mix of earnings in the jurisdictions in which we
operate and prudent and feasible tax planning strategies. In the event we were to determine that it is
more likely than not that we will be unable to realize all or part of our deferred tax assets in the
future, we would increase the valuation allowance and recognize a corresponding charge to earnings or
other comprehensive income in the period in which we make such a determination. Likewise, if we
later determine that we are more likely than not to realize the deferred tax assets, we would reverse
the applicable portion of the previously recognized valuation allowance. In order for us to realize our
deferred tax assets, we must be able to generate sufficient taxable income in the jurisdictions in which
the deferred tax assets are located.
50