HP 2014 Annual Report Download - page 149
Download and view the complete annual report
Please find page 149 of the 2014 HP annual report below. You can navigate through the pages in the report by either clicking on the pages listed below, or by using the keyword search tool below to find specific information within the annual report.-
 1
1 -
2
-
3
-
4
-
5
-
6
-
7
-
8
-
9
-
10
-
11
-
12
-
13
-
14
-
15
-
16
-
17
-
18
-
19
-
20
-
21
-
22
-
23
-
24
-
25
-
26
-
27
-
28
-
29
-
30
-
31
-
32
-
33
-
34
-
35
-
36
-
37
-
38
-
39
-
40
-
41
-
42
-
43
-
44
-
45
-
46
-
47
-
48
-
49
-
50
-
51
-
52
-
53
-
54
-
55
-
56
-
57
-
58
-
59
-
60
-
61
-
62
-
63
-
64
-
65
-
66
-
67
-
68
-
69
-
70
-
71
-
72
-
73
-
74
-
75
-
76
-
77
-
78
-
79
-
80
-
81
-
82
-
83
-
84
-
85
-
86
-
87
-
88
-
89
-
90
-
91
-
92
-
93
-
94
-
95
-
96
-
97
-
98
-
99
-
100
-
101
-
102
-
103
-
104
-
105
-
106
-
107
-
108
-
109
-
110
-
111
-
112
-
113
-
114
-
115
-
116
-
117
-
118
-
119
-
120
-
121
-
122
-
123
-
124
-
125
-
126
-
127
-
128
-
129
-
130
-
131
-
132
-
133
-
134
-
135
-
136
-
137
-
138
-
 139
139 -
 140
140 -
 141
141 -
 142
142 -
 143
143 -
 144
144 -
 145
145 -
 146
146 -
 147
147 -
 148
148 -
 149
149 -
 150
150 -
 151
151 -
 152
152 -
 153
153 -
 154
154 -
 155
155 -
 156
156 -
 157
157 -
 158
158 -
 159
159 -
160
-
161
-
162
-
163
-
164
-
165
-
166
-
167
-
168
-
169
-
170
-
171
-
172
-
173
-
174
-
175
-
176
-
177
-
178
-
179
-
180
-
181
-
182
-
183
-
184
-
185
-
186
-
187
-
188
-
189
-
190
-
191
-
192
-
193
-
194
-
195
-
196
 |
 |
HEWLETT-PACKARD COMPANY AND SUBSIDIARIES
Notes to Consolidated Financial Statements (Continued)
Note 10: Fair Value (Continued)
Other Fair Value Disclosures
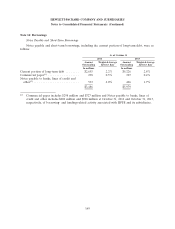
Short- and Long-Term Debt: HP estimates the fair value of its debt primarily using an expected
present value technique, which is based on observable market inputs using interest rates currently
available to companies of similar credit standing for similar terms and remaining maturities, and
considering its own credit risk. The portion of HP’s debt that is hedged is reflected in the Consolidated
Balance Sheets as an amount equal to the debt’s carrying amount and a fair value adjustment
representing changes in the fair value of the hedged debt obligations arising from movements in
benchmark interest rates. The estimated fair value of HP’s short- and long-term debt was $19.9 billion
at October 31, 2014, compared to its carrying amount of $19.5 billion at that date. The estimated fair
value of HP’s short- and long-term debt was $22.7 billion at October 31, 2013, compared to its carrying
amount of $22.6 billion at that date. If measured at fair value in the Consolidated Balance Sheets,
short- and long-term debt would be classified in Level 2 of the fair value hierarchy.
Other Financial Instruments: For the balance of HP’s financial instruments, primarily accounts
receivable, accounts payable and financial liabilities included in other accrued liabilities, the carrying
amounts approximate fair value due to their short maturities. If measured at fair value in the
Consolidated Balance Sheets, these other financial instruments would be classified in Level 2 or
Level 3 of the fair value hierarchy.
Non-Marketable Equity Investments and Non-Financial Assets: HP’s non-marketable equity
investments and non-financial assets, such as intangible assets, goodwill and property, plant and
equipment, are recorded at fair value in the period an impairment charge is recognized. If measured at
fair value in the Consolidated Balance Sheets, these would generally be classified in Level 3 of the fair
value hierarchy.
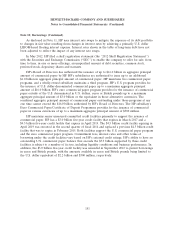
In fiscal 2012, HP recognized a goodwill and intangible asset impairment charge of $8.8 billion
associated with the Autonomy reporting unit, a goodwill impairment charge of $8.0 billion associated
with the ES reporting unit, and an intangible asset impairment charge of $1.2 billion associated with
the Compaq trade name. The fair value of these reporting units was classified in Level 3 of the fair
value hierarchy due to the significance of unobservable inputs developed using company-specific
information. HP used the income approach to measure the fair value of the ES and Autonomy
reporting units. Under the income approach, HP calculated the fair value of a reporting unit based on
the present value of the estimated future cash flows. Cash flow projections were based on
management’s estimates of revenue growth rates and operating margins, taking into consideration
industry and market conditions. The discount rate used was based on the weighted-average cost of
capital adjusted for the relevant risk associated with business-specific characteristics and the uncertainty
related to the business’s ability to execute on the projected cash flows. The discount rate also reflected
adjustments required when comparing the sum of the fair values of HP’s reporting units to HP’s
market capitalization as discussed in Note 9. The unobservable inputs used to estimate the fair value
these reporting units included projected revenue growth rates, profitability and the risk factor added to
the discount rate.
The inputs used to estimate the fair value of the intangible assets of Autonomy and the ‘‘Compaq’’
trade name were largely unobservable, and, accordingly, these measurements were classified in Level 3
of the fair value hierarchy. The fair value of the intangible assets for Autonomy were estimated using
an income approach, which is based on management’s cash flow projections of revenue growth rates
and operating margins, taking into consideration industry and market conditions. HP estimated the fair
value of the ‘‘Compaq’’ trade name by calculating the present value of the royalties saved that would
141