HP 2014 Annual Report Download - page 81
Download and view the complete annual report
Please find page 81 of the 2014 HP annual report below. You can navigate through the pages in the report by either clicking on the pages listed below, or by using the keyword search tool below to find specific information within the annual report.-
 1
1 -
2
-
3
-
4
-
5
-
6
-
7
-
8
-
9
-
10
-
11
-
12
-
13
-
14
-
15
-
16
-
17
-
18
-
19
-
20
-
21
-
22
-
23
-
24
-
25
-
26
-
27
-
28
-
29
-
30
-
31
-
32
-
33
-
34
-
35
-
36
-
37
-
38
-
39
-
40
-
41
-
42
-
43
-
44
-
45
-
46
-
47
-
48
-
49
-
50
-
51
-
52
-
53
-
54
-
55
-
56
-
57
-
58
-
59
-
60
-
61
-
62
-
63
-
64
-
65
-
66
-
67
-
68
-
69
-
70
-
 71
71 -
 72
72 -
 73
73 -
 74
74 -
 75
75 -
 76
76 -
 77
77 -
 78
78 -
 79
79 -
 80
80 -
 81
81 -
 82
82 -
 83
83 -
 84
84 -
 85
85 -
 86
86 -
 87
87 -
 88
88 -
 89
89 -
 90
90 -
 91
91 -
92
-
93
-
94
-
95
-
96
-
97
-
98
-
99
-
100
-
101
-
102
-
103
-
104
-
105
-
106
-
107
-
108
-
109
-
110
-
111
-
112
-
113
-
114
-
115
-
116
-
117
-
118
-
119
-
120
-
121
-
122
-
123
-
124
-
125
-
126
-
127
-
128
-
129
-
130
-
131
-
132
-
133
-
134
-
135
-
136
-
137
-
138
-
139
-
140
-
141
-
142
-
143
-
144
-
145
-
146
-
147
-
148
-
149
-
150
-
151
-
152
-
153
-
154
-
155
-
156
-
157
-
158
-
159
-
160
-
161
-
162
-
163
-
164
-
165
-
166
-
167
-
168
-
169
-
170
-
171
-
172
-
173
-
174
-
175
-
176
-
177
-
178
-
179
-
180
-
181
-
182
-
183
-
184
-
185
-
186
-
187
-
188
-
189
-
190
-
191
-
192
-
193
-
194
-
195
-
196
 |
 |

HEWLETT-PACKARD COMPANY AND SUBSIDIARIES
Management’s Discussion and Analysis of
Financial Condition and Results of Operations (Continued)
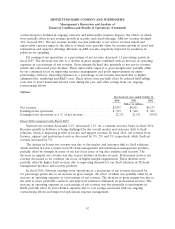
Our key working capital metrics were as follows:
As of October 31
2014 2013 2012
Days of sales outstanding in accounts receivable ........................... 44 49 49
Days of supply in inventory .......................................... 27 24 25
Days of purchases outstanding in accounts payable ......................... (67) (56) (53)
Cash conversion cycle ............................................ 4 17 21
Days of sales outstanding in accounts receivable (‘‘DSO’’) measures the average number of days
our receivables are outstanding. DSO is calculated by dividing ending accounts receivable, net of
allowance for doubtful accounts, by a 90-day average of net revenue. For fiscal 2014, the decrease in
DSO was due primarily to the impact of currency and the expansion of our factoring programs.
Days of supply in inventory (‘‘DOS’’) measures the average number of days from procurement to
sale of our product. DOS is calculated by dividing ending inventory by a 90-day average of cost of
goods sold. For fiscal 2014, the increase in DOS was due to a higher inventory balance in Personal
Systems due in part to strategic and advanced buys.
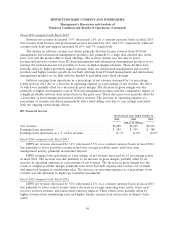
Days of purchases outstanding in accounts payable (‘‘DPO’’) measures the average number of days
our accounts payable balances are outstanding. DPO is calculated by dividing ending accounts payable
by a 90-day average of cost of goods sold. For fiscal 2014, the increase in DPO was primarily the result
of an extension of payment terms with our product suppliers.
The cash conversion cycle is the sum of DSO and DOS less DPO. The cash conversion cycle
ended fiscal 2014 below what we expect to be a long-term sustainable rate. Items which may cause the
cash conversion cycle in a particular period to differ from a long-term sustainable rate include, but are
not limited to, changes in business mix, changes in payment terms, extent of receivables factoring,
seasonal trends and the timing of revenue recognition and inventory purchases within the period.
Investing Activities
Net cash used in investing activities was flat for fiscal 2014 as compared to fiscal 2013, due
primarily to higher cash utilization for purchases of property, plant and equipment offset by cash
generated from sales of available-for-sale securities. Net cash used in investing activities decreased by
$0.7 billion for fiscal 2013 as compared to fiscal 2012, due primarily to lower investments in property,
plant and equipment and higher net sales and maturities of available-for-sale securities.
Financing Activities
Net cash used in financing activities decreased by approximately $1.4 billion for fiscal 2014 as
compared to fiscal 2013. The decrease was due primarily to proceeds from the issuance of U.S. Dollar
Global Notes in January 2014, partially offset by higher debt repayments and repurchases of common
stock. Net cash used in financing activities increased by $4.1 billion for fiscal 2013 as compared to fiscal
2012. The increase was due primarily to higher maturities of debt and net repayments of commercial
paper. For more information on our share repurchase programs, see Item 5 and Note 13 to the
Consolidated Financial Statements in Item 8, which are incorporated herein by reference.
73