HP 2014 Annual Report Download - page 74
Download and view the complete annual report
Please find page 74 of the 2014 HP annual report below. You can navigate through the pages in the report by either clicking on the pages listed below, or by using the keyword search tool below to find specific information within the annual report.-
 1
1 -
2
-
3
-
4
-
5
-
6
-
7
-
8
-
9
-
10
-
11
-
12
-
13
-
14
-
15
-
16
-
17
-
18
-
19
-
20
-
21
-
22
-
23
-
24
-
25
-
26
-
27
-
28
-
29
-
30
-
31
-
32
-
33
-
34
-
35
-
36
-
37
-
38
-
39
-
40
-
41
-
42
-
43
-
44
-
45
-
46
-
47
-
48
-
49
-
50
-
51
-
52
-
53
-
54
-
55
-
56
-
57
-
58
-
59
-
60
-
61
-
62
-
63
-
 64
64 -
 65
65 -
 66
66 -
 67
67 -
 68
68 -
 69
69 -
 70
70 -
 71
71 -
 72
72 -
 73
73 -
 74
74 -
 75
75 -
 76
76 -
 77
77 -
 78
78 -
 79
79 -
 80
80 -
 81
81 -
 82
82 -
 83
83 -
 84
84 -
85
-
86
-
87
-
88
-
89
-
90
-
91
-
92
-
93
-
94
-
95
-
96
-
97
-
98
-
99
-
100
-
101
-
102
-
103
-
104
-
105
-
106
-
107
-
108
-
109
-
110
-
111
-
112
-
113
-
114
-
115
-
116
-
117
-
118
-
119
-
120
-
121
-
122
-
123
-
124
-
125
-
126
-
127
-
128
-
129
-
130
-
131
-
132
-
133
-
134
-
135
-
136
-
137
-
138
-
139
-
140
-
141
-
142
-
143
-
144
-
145
-
146
-
147
-
148
-
149
-
150
-
151
-
152
-
153
-
154
-
155
-
156
-
157
-
158
-
159
-
160
-
161
-
162
-
163
-
164
-
165
-
166
-
167
-
168
-
169
-
170
-
171
-
172
-
173
-
174
-
175
-
176
-
177
-
178
-
179
-
180
-
181
-
182
-
183
-
184
-
185
-
186
-
187
-
188
-
189
-
190
-
191
-
192
-
193
-
194
-
195
-
196
 |
 |

HEWLETT-PACKARD COMPANY AND SUBSIDIARIES
Management’s Discussion and Analysis of
Financial Condition and Results of Operations (Continued)
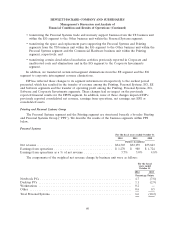
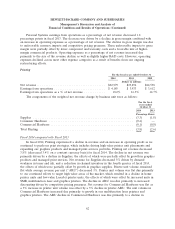
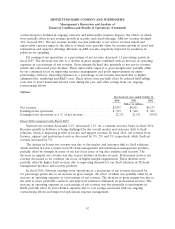
The components of the weighted net revenue change by business unit were as follows:
For the fiscal
years ended
October 31
2014 2013
Percentage Points
Infrastructure Technology Outsourcing ................................... (4.9) (3.7)
Application and Business Services ....................................... (2.0) (3.7)
Total Enterprise Services ............................................. (6.9) (7.4)
Fiscal 2014 compared with Fiscal 2013
ES net revenue decreased 6.9% (decreased 6.8% on a constant currency basis) in fiscal 2014.
Performance in ES remains challenged by the impact of several large contracts winding down and lower
public sector spending in EMEA, particularly in the United Kingdom, and several other countries in
EMEA. The net revenue decrease in ES was due primarily to revenue runoff in key accounts, weak
growth in new and existing accounts, particularly in EMEA, and contractual price declines. These
effects were partially offset by net revenue growth in our SES portfolio, which includes information
management and analytics, security and cloud services. Net revenue in Infrastructure Technology
Outsourcing (‘‘ITO’’) decreased by 8% in fiscal 2014 due to revenue runoff in key accounts, weak
growth in new and existing accounts, particularly in EMEA, and contractual price declines in ongoing
contracts partially offset by growth in cloud and security revenue and favorable currency impacts. Net
revenue in Application and Business Services (‘‘ABS’’) decreased by 5% in fiscal 2014, due to revenue
runoff in a key account, weak growth in new and existing accounts, particularly in EMEA, and
unfavorable currency impacts, partially offset by growth in information management and analytics and
cloud revenue.
ES earnings from operations as a percentage of net revenue increased 0.8 percentage points in
fiscal 2014. The increase in operating margin was due to an increase in gross margin, partially offset by
an increase in operating expenses as a percentage of net revenue. Gross margin increased due primarily
to our continued focus on service delivery efficiencies, improving profit performance in under-
performing contracts and labor savings as a result of restructuring, partially offset by unfavorable
impacts from revenue runoff in key accounts and weak growth in new and existing accounts. The
increase in operating expenses as a percentage of net revenue was primarily driven by the size of the
revenue decline and higher administrative expenses and field selling costs. The increase in current year
administrative expenses was due to the prior-year period containing higher bad debt recoveries and
insurance recoveries. The increase in selling costs was the result of expanding the sales force coverage
as we transition from a reactive sales model to a more proactive approach.
Fiscal 2013 compared with Fiscal 2012
ES net revenue decreased 7.4% (decreased 6.3% on a constant currency basis) in fiscal 2013.
Revenue performance in ES continues to be challenged by several factors that impact the demand
environment, including weak public sector spending in the U.S. and austerity measures in other
countries, particularly in the United Kingdom, and weak IT services spend due to the mixed global
recovery, particularly in the EMEA region. The net revenue decrease in ES was driven primarily by net
service revenue runoff, contractual price declines in ongoing contracts and unfavorable currency
impacts. ITO net revenue decreased by 6% in fiscal 2013, due to net service revenue runoff,
66