HP 2014 Annual Report Download - page 73
Download and view the complete annual report
Please find page 73 of the 2014 HP annual report below. You can navigate through the pages in the report by either clicking on the pages listed below, or by using the keyword search tool below to find specific information within the annual report.-
 1
1 -
2
-
3
-
4
-
5
-
6
-
7
-
8
-
9
-
10
-
11
-
12
-
13
-
14
-
15
-
16
-
17
-
18
-
19
-
20
-
21
-
22
-
23
-
24
-
25
-
26
-
27
-
28
-
29
-
30
-
31
-
32
-
33
-
34
-
35
-
36
-
37
-
38
-
39
-
40
-
41
-
42
-
43
-
44
-
45
-
46
-
47
-
48
-
49
-
50
-
51
-
52
-
53
-
54
-
55
-
56
-
57
-
58
-
59
-
60
-
61
-
62
-
 63
63 -
 64
64 -
 65
65 -
 66
66 -
 67
67 -
 68
68 -
 69
69 -
 70
70 -
 71
71 -
 72
72 -
 73
73 -
 74
74 -
 75
75 -
 76
76 -
 77
77 -
 78
78 -
 79
79 -
 80
80 -
 81
81 -
 82
82 -
 83
83 -
84
-
85
-
86
-
87
-
88
-
89
-
90
-
91
-
92
-
93
-
94
-
95
-
96
-
97
-
98
-
99
-
100
-
101
-
102
-
103
-
104
-
105
-
106
-
107
-
108
-
109
-
110
-
111
-
112
-
113
-
114
-
115
-
116
-
117
-
118
-
119
-
120
-
121
-
122
-
123
-
124
-
125
-
126
-
127
-
128
-
129
-
130
-
131
-
132
-
133
-
134
-
135
-
136
-
137
-
138
-
139
-
140
-
141
-
142
-
143
-
144
-
145
-
146
-
147
-
148
-
149
-
150
-
151
-
152
-
153
-
154
-
155
-
156
-
157
-
158
-
159
-
160
-
161
-
162
-
163
-
164
-
165
-
166
-
167
-
168
-
169
-
170
-
171
-
172
-
173
-
174
-
175
-
176
-
177
-
178
-
179
-
180
-
181
-
182
-
183
-
184
-
185
-
186
-
187
-
188
-
189
-
190
-
191
-
192
-
193
-
194
-
195
-
196
 |
 |

HEWLETT-PACKARD COMPANY AND SUBSIDIARIES
Management’s Discussion and Analysis of
Financial Condition and Results of Operations (Continued)
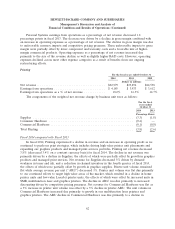
by supply chain cost optimization and improved cost management in TS. The increase in operating
expenses as a percentage of net revenue was driven by higher R&D investments in storage, networking
and ISS, partially offset by continued cost savings associated with our ongoing restructuring efforts.
Fiscal 2013 compared with Fiscal 2012
EG net revenue decreased 5.3% (decreased 4.2% on a constant currency basis) in fiscal 2013 due
primarily to the macroeconomic demand challenges the business faced during the fiscal year.
Additionally, new product and technology transitions in Storage and ISS and a competitive pricing
environment contributed to the revenue decline. EG also experienced execution challenges that
impacted revenue growth in fiscal 2013, although those challenges moderated in the fourth quarter due
to improved sales execution. Each of the business units within EG experienced year-over-year revenue
declines in fiscal 2013 except Networking. ISS net revenue decreased by 4% due to competitive pricing
and soft demand. Within ISS, we experienced a revenue decline in our core mainstream products that
was partially offset by revenue growth in our hyperscale server products. TS net revenue decreased by
4% due to revenue declines in the support and consulting businesses and, to a lesser extent, to
unfavorable currency impacts. Support revenue declined due to a reduction in support for BCS
products. The consulting revenue decline was a result of unfavorable currency impacts, the divestiture
of a service product line and a shift to more profitable services such as data center and storage
consulting. BCS net revenue decreased by 26% as a result of ongoing pressures from the decline in the
overall UNIX market along with lower demand for our Itanium-based servers. Storage net revenue
decreased by 9% due to declines in traditional storage products, which include our tape, storage
networking, and legacy external disk products, the effects of which were partially offset by growth in
Converged Storage solutions, which include our 3PAR, StoreOnce, StoreVirtual and StoreAll products.
Networking revenue increased by 2% due to higher demand for our switching, routing, and wireless
products, the effect of which was partially offset by the impact of the divestiture of our video
surveillance business in the first quarter of fiscal 2012.
EG earnings from operations as a percentage of net revenue decreased by 2.1 percentage points in
fiscal 2013 driven by a decrease in gross margin and, to a lesser extent, an increase in operating
expenses as a percentage of net revenue. The gross margin decrease was due primarily to competitive
pricing pressures in ISS and, to a lesser extent, pricing pressures in Storage and mix impacts from lower
BCS revenue. Operating expenses as a percentage of net revenue increased due to the decline in EG
net revenue and increased field selling costs and administrative expenses. R&D expenses as a
percentage of net revenue decreased due primarily to the rationalization of R&D specifically for BCS
and a value-added tax subsidy credit in BCS. EG also benefited from cost savings resulting from our
ongoing restructuring efforts.
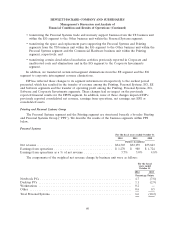
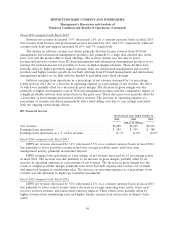
Enterprise Services
For the fiscal years ended October 31
2014 2013 2012
Dollars in millions
Net revenue ........................................... $22,398 $24,061 $25,993
Earnings from operations ................................. $ 803 $ 679 $ 1,045
Earnings from operations as a % of net revenue ................ 3.6% 2.8% 4.0%
65