HP 2014 Annual Report Download - page 77
Download and view the complete annual report
Please find page 77 of the 2014 HP annual report below. You can navigate through the pages in the report by either clicking on the pages listed below, or by using the keyword search tool below to find specific information within the annual report.-
 1
1 -
2
-
3
-
4
-
5
-
6
-
7
-
8
-
9
-
10
-
11
-
12
-
13
-
14
-
15
-
16
-
17
-
18
-
19
-
20
-
21
-
22
-
23
-
24
-
25
-
26
-
27
-
28
-
29
-
30
-
31
-
32
-
33
-
34
-
35
-
36
-
37
-
38
-
39
-
40
-
41
-
42
-
43
-
44
-
45
-
46
-
47
-
48
-
49
-
50
-
51
-
52
-
53
-
54
-
55
-
56
-
57
-
58
-
59
-
60
-
61
-
62
-
63
-
64
-
65
-
66
-
 67
67 -
 68
68 -
 69
69 -
 70
70 -
 71
71 -
 72
72 -
 73
73 -
 74
74 -
 75
75 -
 76
76 -
 77
77 -
 78
78 -
 79
79 -
 80
80 -
 81
81 -
 82
82 -
 83
83 -
 84
84 -
 85
85 -
 86
86 -
 87
87 -
88
-
89
-
90
-
91
-
92
-
93
-
94
-
95
-
96
-
97
-
98
-
99
-
100
-
101
-
102
-
103
-
104
-
105
-
106
-
107
-
108
-
109
-
110
-
111
-
112
-
113
-
114
-
115
-
116
-
117
-
118
-
119
-
120
-
121
-
122
-
123
-
124
-
125
-
126
-
127
-
128
-
129
-
130
-
131
-
132
-
133
-
134
-
135
-
136
-
137
-
138
-
139
-
140
-
141
-
142
-
143
-
144
-
145
-
146
-
147
-
148
-
149
-
150
-
151
-
152
-
153
-
154
-
155
-
156
-
157
-
158
-
159
-
160
-
161
-
162
-
163
-
164
-
165
-
166
-
167
-
168
-
169
-
170
-
171
-
172
-
173
-
174
-
175
-
176
-
177
-
178
-
179
-
180
-
181
-
182
-
183
-
184
-
185
-
186
-
187
-
188
-
189
-
190
-
191
-
192
-
193
-
194
-
195
-
196
 |
 |

HEWLETT-PACKARD COMPANY AND SUBSIDIARIES
Management’s Discussion and Analysis of
Financial Condition and Results of Operations (Continued)
HPFS earnings from operations as a percentage of net revenue increased by 0.8 percentage points
in fiscal 2013. The increase was due primarily to an increase in gross margin, the effect of which was
partially offset by an increase in operating expenses as a percentage of net revenue as a result of higher
IT investments. The increase in gross margin was the result of higher portfolio margin from a lower
mix of operating leases, higher margin on early buyouts and lower bad debt expense.
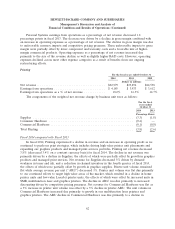
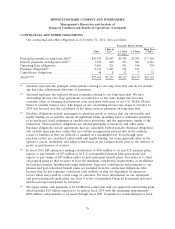
Financing Originations
For the fiscal years ended October 31
2014 2013 2012
Dollars in millions
Total financing originations .............................. $6,425 $5,603 $6,590
New financing originations, which represent the amount of financing provided to customers for
equipment and related software and services, including intercompany activity, increased 14.7% in fiscal
2014 and decreased 15.0% in fiscal 2013, respectively. The increase in fiscal 2014 was driven by higher
financing associated with HP product sales and related services offerings, while the decrease in fiscal
2013 was primarily driven by lower financing associated with HP product sales and services offerings,
and to a lesser extent unfavorable currency impacts.
Portfolio Assets and Ratios
The HPFS business model is asset intensive and uses certain internal metrics to measure its
performance against other financial services companies, including a segment balance sheet that is
derived from our internal management reporting system. The accounting policies used to derive HPFS
amounts are substantially the same as those used by HP. However, intercompany loans and certain
accounts that are reflected in the segment balances are eliminated in our Consolidated Financial
Statements.
69