HP 2014 Annual Report Download - page 113
Download and view the complete annual report
Please find page 113 of the 2014 HP annual report below. You can navigate through the pages in the report by either clicking on the pages listed below, or by using the keyword search tool below to find specific information within the annual report.-
 1
1 -
2
-
3
-
4
-
5
-
6
-
7
-
8
-
9
-
10
-
11
-
12
-
13
-
14
-
15
-
16
-
17
-
18
-
19
-
20
-
21
-
22
-
23
-
24
-
25
-
26
-
27
-
28
-
29
-
30
-
31
-
32
-
33
-
34
-
35
-
36
-
37
-
38
-
39
-
40
-
41
-
42
-
43
-
44
-
45
-
46
-
47
-
48
-
49
-
50
-
51
-
52
-
53
-
54
-
55
-
56
-
57
-
58
-
59
-
60
-
61
-
62
-
63
-
64
-
65
-
66
-
67
-
68
-
69
-
70
-
71
-
72
-
73
-
74
-
75
-
76
-
77
-
78
-
79
-
80
-
81
-
82
-
83
-
84
-
85
-
86
-
87
-
88
-
89
-
90
-
91
-
92
-
93
-
94
-
95
-
96
-
97
-
98
-
99
-
100
-
101
-
102
-
 103
103 -
 104
104 -
 105
105 -
 106
106 -
 107
107 -
 108
108 -
 109
109 -
 110
110 -
 111
111 -
 112
112 -
 113
113 -
 114
114 -
 115
115 -
 116
116 -
 117
117 -
 118
118 -
 119
119 -
 120
120 -
 121
121 -
 122
122 -
 123
123 -
124
-
125
-
126
-
127
-
128
-
129
-
130
-
131
-
132
-
133
-
134
-
135
-
136
-
137
-
138
-
139
-
140
-
141
-
142
-
143
-
144
-
145
-
146
-
147
-
148
-
149
-
150
-
151
-
152
-
153
-
154
-
155
-
156
-
157
-
158
-
159
-
160
-
161
-
162
-
163
-
164
-
165
-
166
-
167
-
168
-
169
-
170
-
171
-
172
-
173
-
174
-
175
-
176
-
177
-
178
-
179
-
180
-
181
-
182
-
183
-
184
-
185
-
186
-
187
-
188
-
189
-
190
-
191
-
192
-
193
-
194
-
195
-
196
 |
 |

HEWLETT-PACKARD COMPANY AND SUBSIDIARIES
Notes to Consolidated Financial Statements (Continued)
Note 2: Segment Information (Continued)
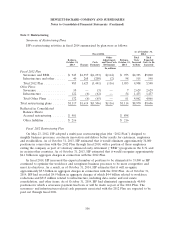
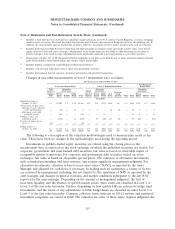
Net property, plant and equipment by country in which HP operates was as follows:
As of October 31
2014 2013
In millions
U.S. ......................................................... $ 5,668 $ 5,546
The United Kingdom. ............................................. 1,053 1,090
Other countries .................................................. 4,619 4,827
Total net property, plant and equipment .............................. $11,340 $11,463
Net revenue by segment and business unit was as follows:
For the fiscal years ended October 31
2014 2013 2012
In millions
Notebooks ........................................... $ 17,540 $ 16,029 $ 18,830
Desktops ............................................ 13,197 12,844 13,888
Workstations .......................................... 2,218 2,147 2,148
Other ............................................... 1,348 1,159 977
Personal Systems ..................................... 34,303 32,179 35,843
Supplies ............................................. 14,917 15,716 16,151
Commercial Hardware ................................... 5,717 5,744 5,946
Consumer Hardware .................................... 2,345 2,436 2,441
Printing ............................................ 22,979 23,896 24,538
Total Printing and Personal Systems Group ................ 57,282 56,075 60,381
Industry Standard Servers ................................ 12,474 12,102 12,582
Technology Services ..................................... 8,466 8,788 9,152
Storage .............................................. 3,316 3,475 3,815
Networking ........................................... 2,629 2,526 2,482
Business Critical Systems ................................. 929 1,190 1,612
Enterprise Group ..................................... 27,814 28,081 29,643
Infrastructure Technology Outsourcing ....................... 14,038 15,223 16,176
Application and Business Services .......................... 8,360 8,838 9,817
Enterprise Services ................................... 22,398 24,061 25,993
Software ........................................... 3,933 4,021 4,171
HP Financial Services ................................. 3,498 3,629 3,819
Corporate Investments ................................. 302 24 58
Total segment net revenue ........................... 115,227 115,891 124,065
Eliminations of intersegment net revenue and other ........ (3,773) (3,593) (3,708)
Total net revenue ................................ $111,454 $112,298 $120,357
105