HP 2014 Annual Report Download - page 76
Download and view the complete annual report
Please find page 76 of the 2014 HP annual report below. You can navigate through the pages in the report by either clicking on the pages listed below, or by using the keyword search tool below to find specific information within the annual report.-
 1
1 -
2
-
3
-
4
-
5
-
6
-
7
-
8
-
9
-
10
-
11
-
12
-
13
-
14
-
15
-
16
-
17
-
18
-
19
-
20
-
21
-
22
-
23
-
24
-
25
-
26
-
27
-
28
-
29
-
30
-
31
-
32
-
33
-
34
-
35
-
36
-
37
-
38
-
39
-
40
-
41
-
42
-
43
-
44
-
45
-
46
-
47
-
48
-
49
-
50
-
51
-
52
-
53
-
54
-
55
-
56
-
57
-
58
-
59
-
60
-
61
-
62
-
63
-
64
-
65
-
 66
66 -
 67
67 -
 68
68 -
 69
69 -
 70
70 -
 71
71 -
 72
72 -
 73
73 -
 74
74 -
 75
75 -
 76
76 -
 77
77 -
 78
78 -
 79
79 -
 80
80 -
 81
81 -
 82
82 -
 83
83 -
 84
84 -
 85
85 -
 86
86 -
87
-
88
-
89
-
90
-
91
-
92
-
93
-
94
-
95
-
96
-
97
-
98
-
99
-
100
-
101
-
102
-
103
-
104
-
105
-
106
-
107
-
108
-
109
-
110
-
111
-
112
-
113
-
114
-
115
-
116
-
117
-
118
-
119
-
120
-
121
-
122
-
123
-
124
-
125
-
126
-
127
-
128
-
129
-
130
-
131
-
132
-
133
-
134
-
135
-
136
-
137
-
138
-
139
-
140
-
141
-
142
-
143
-
144
-
145
-
146
-
147
-
148
-
149
-
150
-
151
-
152
-
153
-
154
-
155
-
156
-
157
-
158
-
159
-
160
-
161
-
162
-
163
-
164
-
165
-
166
-
167
-
168
-
169
-
170
-
171
-
172
-
173
-
174
-
175
-
176
-
177
-
178
-
179
-
180
-
181
-
182
-
183
-
184
-
185
-
186
-
187
-
188
-
189
-
190
-
191
-
192
-
193
-
194
-
195
-
196
 |
 |

HEWLETT-PACKARD COMPANY AND SUBSIDIARIES
Management’s Discussion and Analysis of
Financial Condition and Results of Operations (Continued)
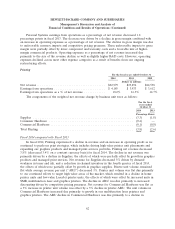
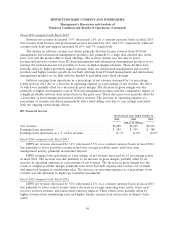
Fiscal 2013 compared with Fiscal 2012
Software net revenue decreased 3.6% (decreased 2.6% on a constant currency basis) in fiscal 2013.
Net revenue from licenses and professional services decreased by 16% and 13%, respectively, while net
revenue from SaaS and support increased by 10% and 7%, respectively.
The decline in software revenue was driven primarily by lower license revenue from IT/cloud
management and information management products, due primarily to a large deal entered into in the
prior year and the market shift to SaaS offerings. The revenue decline was also due to lower
professional services revenue from IT/cloud management and information management products as we
manage the professional services portfolio to focus on higher-margin solutions. These declines were
partially offset by higher growth in support revenue from our information management and security
products and higher revenue growth in our SaaS offerings from IT/cloud management and information
management products as we shift with the market to providing more SaaS offerings.
Software earnings from operations as a percentage of net revenue increased by 1.6 percentage
points in fiscal 2013 due to a decrease in operating expense as a percentage of net revenue, the effect
of which was partially offset by a decrease in gross margin. The decrease in gross margin was due
primarily to higher development costs in IT/cloud management products and the comparative impact of
a highly profitable software deal entered into in the prior year. These decreases were partially offset by
a lower mix of lower-margin professional services revenue. The decrease in operating expense as a
percentage of revenue was driven primarily by lower field selling costs due to cost savings associated
with our ongoing restructuring efforts.
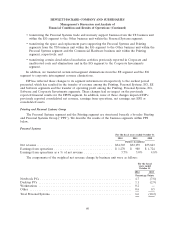
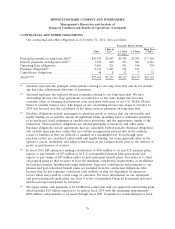
HP Financial Services
For the fiscal years ended October 31
2014 2013 2012
Dollars in millions
Net revenue ......................................... $3,498 $3,629 $3,819
Earnings from operations ............................... $ 389 $ 399 $ 388
Earnings from operations as a % of net revenue ............... 11.1% 11.0% 10.2%
Fiscal 2014 compared with Fiscal 2013
HPFS net revenue decreased by 3.6% (decreased 3.3% on a constant currency basis) in fiscal 2014
due primarily to lower portfolio revenue from lower average portfolio assets and lower asset
management activity, primarily in customer buyouts.
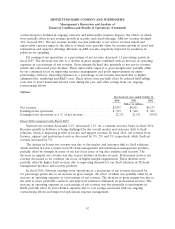
HPFS earnings from operations as a percentage of net revenue increased by 0.1 percentage points
in fiscal 2014. The increase was due primarily to an increase in gross margin, partially offset by an
increase in operating expenses as a percentage of net revenue. The increase in gross margin was the
result of a higher portfolio margin, primarily from lower bad debt expense and a lower cost of funds
and improved margins in remarketing sales. The increase in operating expenses as a percentage of net
revenue was due primarily to higher go-to-market investments.
Fiscal 2013 compared with Fiscal 2012
HPFS net revenue decreased by 5.0% (decreased 4.2% on a constant currency basis) in fiscal 2013
due primarily to lower rental revenue from a decrease in average operating lease assets, lower asset
recovery services revenue, and unfavorable currency impacts. These effects were partially offset by
higher revenue from remarketing sales and higher finance income from an increase in finance lease
assets.
68