HP 2014 Annual Report Download - page 72
Download and view the complete annual report
Please find page 72 of the 2014 HP annual report below. You can navigate through the pages in the report by either clicking on the pages listed below, or by using the keyword search tool below to find specific information within the annual report.-
 1
1 -
2
-
3
-
4
-
5
-
6
-
7
-
8
-
9
-
10
-
11
-
12
-
13
-
14
-
15
-
16
-
17
-
18
-
19
-
20
-
21
-
22
-
23
-
24
-
25
-
26
-
27
-
28
-
29
-
30
-
31
-
32
-
33
-
34
-
35
-
36
-
37
-
38
-
39
-
40
-
41
-
42
-
43
-
44
-
45
-
46
-
47
-
48
-
49
-
50
-
51
-
52
-
53
-
54
-
55
-
56
-
57
-
58
-
59
-
60
-
61
-
 62
62 -
 63
63 -
 64
64 -
 65
65 -
 66
66 -
 67
67 -
 68
68 -
 69
69 -
 70
70 -
 71
71 -
 72
72 -
 73
73 -
 74
74 -
 75
75 -
 76
76 -
 77
77 -
 78
78 -
 79
79 -
 80
80 -
 81
81 -
 82
82 -
83
-
84
-
85
-
86
-
87
-
88
-
89
-
90
-
91
-
92
-
93
-
94
-
95
-
96
-
97
-
98
-
99
-
100
-
101
-
102
-
103
-
104
-
105
-
106
-
107
-
108
-
109
-
110
-
111
-
112
-
113
-
114
-
115
-
116
-
117
-
118
-
119
-
120
-
121
-
122
-
123
-
124
-
125
-
126
-
127
-
128
-
129
-
130
-
131
-
132
-
133
-
134
-
135
-
136
-
137
-
138
-
139
-
140
-
141
-
142
-
143
-
144
-
145
-
146
-
147
-
148
-
149
-
150
-
151
-
152
-
153
-
154
-
155
-
156
-
157
-
158
-
159
-
160
-
161
-
162
-
163
-
164
-
165
-
166
-
167
-
168
-
169
-
170
-
171
-
172
-
173
-
174
-
175
-
176
-
177
-
178
-
179
-
180
-
181
-
182
-
183
-
184
-
185
-
186
-
187
-
188
-
189
-
190
-
191
-
192
-
193
-
194
-
195
-
196
 |
 |

HEWLETT-PACKARD COMPANY AND SUBSIDIARIES
Management’s Discussion and Analysis of
Financial Condition and Results of Operations (Continued)
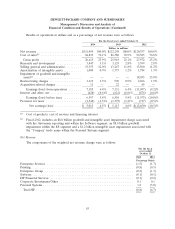
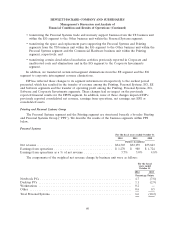
Enterprise Group
For the fiscal years ended October 31
2014 2013 2012
Dollars in millions
Net revenue ........................................... $27,814 $28,081 $29,643
Earnings from operations ................................. $ 4,008 $ 4,259 $ 5,123
Earnings from operations as a % of net revenue ................ 14.4% 15.2% 17.3%
The components of the weighted net revenue change by business unit were as follows for the
following fiscal years ended October 31:
For the fiscal
years ended
October 31
2014 2013
Percentage Points
Technology Services ................................................. (1.1) (1.3)
Business Critical Systems ............................................. (0.9) (1.4)
Storage .......................................................... (0.6) (1.1)
Networking ....................................................... 0.3 0.1
Industry Standard Servers ............................................. 1.3 (1.6)
Total Enterprise Group .............................................. (1.0) (5.3)
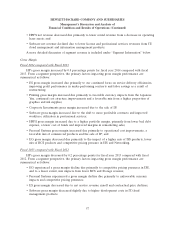
Fiscal 2014 compared with Fiscal 2013
EG net revenue decreased 1.0% (decreased 0.6% on a constant currency basis) in fiscal 2014. In
EG, we continue to experience revenue challenges due to market trends, including the transition to
cloud computing, as well as product and technology transitions, along with a highly competitive pricing
environment. The decline in EG net revenue was due to net revenue declines in TS, BCS and Storage
partially offset by net revenue growth in ISS and Networking.
TS net revenue decreased 4% due primarily to a continued reduction in support for BCS,
traditional storage products and lower support in networking services, partially offset by growth in
support solutions for converged storage solutions and ISS. BCS net revenue decreased 22% as a result
of ongoing pressures from the overall UNIX market contraction. Storage net revenue decreased by 5%
as we continue to experience multiple challenges including product transitions from traditional storage
products which include our tape, storage networking and legacy external disk products, to converged
solutions, which include our 3PAR StoreServ, StoreOnce, and StoreVirtual products, other challenges
include market weakness in high-end converged solutions and sales execution challenges, the effects of
which were partially offset by revenue growth in our Converged Storage solutions. Networking net
revenue increased 4% due to higher switching product revenue as a result of growth in our data center
products, partially offset by lower revenue from wireless local area network products. ISS net revenue
increased by 3% due primarily to higher volume and higher average unit prices in rack and blade
server products driven by higher option attach rates for memory, processors and hard drives.
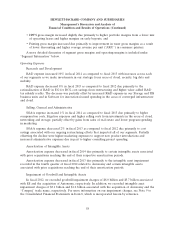
EG earnings from operations as a percentage of net revenue decreased by 0.8 percentage points in
fiscal 2014 due to a decrease in gross margin coupled with an increase in operating expenses as a
percentage of net revenue. The gross margin decline was due primarily to a higher mix of ISS products,
a lower mix of BCS products and competitive pricing pressure in ISS and Networking, partially offset
64