HP 2014 Annual Report Download - page 78
Download and view the complete annual report
Please find page 78 of the 2014 HP annual report below. You can navigate through the pages in the report by either clicking on the pages listed below, or by using the keyword search tool below to find specific information within the annual report.-
 1
1 -
2
-
3
-
4
-
5
-
6
-
7
-
8
-
9
-
10
-
11
-
12
-
13
-
14
-
15
-
16
-
17
-
18
-
19
-
20
-
21
-
22
-
23
-
24
-
25
-
26
-
27
-
28
-
29
-
30
-
31
-
32
-
33
-
34
-
35
-
36
-
37
-
38
-
39
-
40
-
41
-
42
-
43
-
44
-
45
-
46
-
47
-
48
-
49
-
50
-
51
-
52
-
53
-
54
-
55
-
56
-
57
-
58
-
59
-
60
-
61
-
62
-
63
-
64
-
65
-
66
-
67
-
 68
68 -
 69
69 -
 70
70 -
 71
71 -
 72
72 -
 73
73 -
 74
74 -
 75
75 -
 76
76 -
 77
77 -
 78
78 -
 79
79 -
 80
80 -
 81
81 -
 82
82 -
 83
83 -
 84
84 -
 85
85 -
 86
86 -
 87
87 -
 88
88 -
89
-
90
-
91
-
92
-
93
-
94
-
95
-
96
-
97
-
98
-
99
-
100
-
101
-
102
-
103
-
104
-
105
-
106
-
107
-
108
-
109
-
110
-
111
-
112
-
113
-
114
-
115
-
116
-
117
-
118
-
119
-
120
-
121
-
122
-
123
-
124
-
125
-
126
-
127
-
128
-
129
-
130
-
131
-
132
-
133
-
134
-
135
-
136
-
137
-
138
-
139
-
140
-
141
-
142
-
143
-
144
-
145
-
146
-
147
-
148
-
149
-
150
-
151
-
152
-
153
-
154
-
155
-
156
-
157
-
158
-
159
-
160
-
161
-
162
-
163
-
164
-
165
-
166
-
167
-
168
-
169
-
170
-
171
-
172
-
173
-
174
-
175
-
176
-
177
-
178
-
179
-
180
-
181
-
182
-
183
-
184
-
185
-
186
-
187
-
188
-
189
-
190
-
191
-
192
-
193
-
194
-
195
-
196
 |
 |

HEWLETT-PACKARD COMPANY AND SUBSIDIARIES
Management’s Discussion and Analysis of
Financial Condition and Results of Operations (Continued)
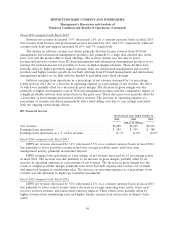
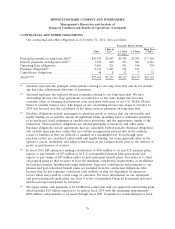
The portfolio assets and ratios derived from the segment balance sheet for HPFS were as follows:
As of October 31
2014 2013
Dollars in millions
Financing receivables, gross ......................................... $ 6,670 $ 7,153
Net equipment under operating leases ................................. 2,595 2,370
Capitalized profit on intercompany equipment transactions(1) ................. 783 715
Intercompany leases(1) ............................................. 2,199 2,202
Gross portfolio assets ............................................. 12,247 12,440
Allowance for doubtful accounts(2) .................................... 111 131
Operating lease equipment reserve .................................... 68 76
Total reserves ................................................... 179 207
Net portfolio assets ............................................... $12,068 $12,233
Reserve coverage ................................................ 1.5% 1.7%
Debt-to-equity ratio(3) ............................................. 7.0x 7.0x
(1) Intercompany activity is eliminated in consolidation.
(2) Allowance for doubtful accounts for financing receivables includes both the short- and long-term
portions.
(3) Debt attributable to HPFS consists of intercompany equity that is treated as debt for segment
reporting purposes, intercompany debt, and borrowing- and funding-related activity associated with
HPFS and its subsidiaries. Debt attributable to HPFS totaled $10.7 billion and $10.8 billion at
October 31, 2014 and October 31, 2013, respectively. HPFS equity at both October 31, 2014 and
October 31, 2013 was $1.5 billion. We believe the HPFS debt-to-equity ratio is comparable to that
of other similar financing companies.
At October 31, 2014 and October 31, 2013, HPFS cash balances were $829 million and
$697 million, respectively.
Net portfolio assets at October 31, 2014 decreased 1.3% from October 31, 2013. The decrease
generally resulted from unfavorable currency impacts, partially offset by new financing volume in excess
of portfolio runoff.
HPFS recorded net bad debt expenses and operating lease equipment reserves of $40 million,
$50 million and $62 million in fiscal 2014, 2013 and 2012, respectively.
70