HP 2014 Annual Report Download - page 148
Download and view the complete annual report
Please find page 148 of the 2014 HP annual report below. You can navigate through the pages in the report by either clicking on the pages listed below, or by using the keyword search tool below to find specific information within the annual report.-
 1
1 -
2
-
3
-
4
-
5
-
6
-
7
-
8
-
9
-
10
-
11
-
12
-
13
-
14
-
15
-
16
-
17
-
18
-
19
-
20
-
21
-
22
-
23
-
24
-
25
-
26
-
27
-
28
-
29
-
30
-
31
-
32
-
33
-
34
-
35
-
36
-
37
-
38
-
39
-
40
-
41
-
42
-
43
-
44
-
45
-
46
-
47
-
48
-
49
-
50
-
51
-
52
-
53
-
54
-
55
-
56
-
57
-
58
-
59
-
60
-
61
-
62
-
63
-
64
-
65
-
66
-
67
-
68
-
69
-
70
-
71
-
72
-
73
-
74
-
75
-
76
-
77
-
78
-
79
-
80
-
81
-
82
-
83
-
84
-
85
-
86
-
87
-
88
-
89
-
90
-
91
-
92
-
93
-
94
-
95
-
96
-
97
-
98
-
99
-
100
-
101
-
102
-
103
-
104
-
105
-
106
-
107
-
108
-
109
-
110
-
111
-
112
-
113
-
114
-
115
-
116
-
117
-
118
-
119
-
120
-
121
-
122
-
123
-
124
-
125
-
126
-
127
-
128
-
129
-
130
-
131
-
132
-
133
-
134
-
135
-
136
-
137
-
 138
138 -
 139
139 -
 140
140 -
 141
141 -
 142
142 -
 143
143 -
 144
144 -
 145
145 -
 146
146 -
 147
147 -
 148
148 -
 149
149 -
 150
150 -
 151
151 -
 152
152 -
 153
153 -
 154
154 -
 155
155 -
 156
156 -
 157
157 -
 158
158 -
159
-
160
-
161
-
162
-
163
-
164
-
165
-
166
-
167
-
168
-
169
-
170
-
171
-
172
-
173
-
174
-
175
-
176
-
177
-
178
-
179
-
180
-
181
-
182
-
183
-
184
-
185
-
186
-
187
-
188
-
189
-
190
-
191
-
192
-
193
-
194
-
195
-
196
 |
 |

HEWLETT-PACKARD COMPANY AND SUBSIDIARIES
Notes to Consolidated Financial Statements (Continued)
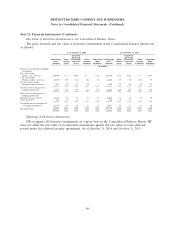
Note 10: Fair Value (Continued)
The following table presents HP’s assets and liabilities that are measured at fair value on a
recurring basis:
As of October 31, 2014 As of October 31, 2013
Fair Value Fair Value
Measured Using Measured Using
Level 1 Level 2 Level 3 Total Level 1 Level 2 Level 3 Total
In millions
Assets
Cash Equivalents and Investments:
Time deposits .................. $ — $2,865 $— $ 2,865 $ — $2,221 $— $ 2,221
Money market funds ............. 9,857 — — 9,857 6,819 — — 6,819
Mutual funds ................... — 244 — 244 — 313 — 313
Marketable equity securities ........ 14 5 — 19 10 5 — 15
Foreign bonds .................. 9 367 — 376 9 387 — 396
Other debt securities ............. — 1 46 47 — 2 47 49
Derivatives:
Interest rate contracts ............. — 105 — 105 — 156 — 156
Foreign exchange contracts ......... — 862 6 868 — 284 3 287
Other derivatives ................ — 7 — 7 — 9 — 9
Total assets ................... $9,880 $4,456 $52 $14,388 $6,838 $3,377 $50 $10,265
Liabilities
Derivatives:
Interest rate contracts ............. $ — $ 55 $— $ 55 $ — $ 107 $— $ 107
Foreign exchange contracts ......... — 348 2 350 — 547 2 549
Total liabilities ................ $ — $ 403 $ 2 $ 405 $ — $ 654 $ 2 $ 656
For the year ended October 31, 2014, there were no transfers between levels within the fair value
hierarchy.
Valuation Techniques
Cash Equivalents and Investments: HP holds time deposits, money market funds, mutual funds,
other debt securities primarily consisting of corporate and foreign government notes and bonds, and
common stock and equivalents. HP values cash equivalents and equity investments using quoted market
prices, alternative pricing sources, including NAV, or models utilizing market observable inputs. The fair
value of debt investments was based on quoted market prices or model-driven valuations using inputs
primarily derived from or corroborated by observable market data, and, in certain instances, valuation
models that utilize assumptions which cannot be corroborated with observable market data.
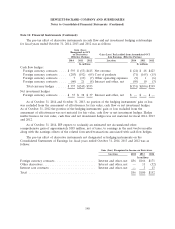
Derivative Instruments: HP uses forward contracts, interest rate and total return swaps and
option contracts to hedge certain foreign currency and interest rate exposures. HP uses industry
standard valuation models to measure fair value. Where applicable, these models project future cash
flows and discount the future amounts to present value using market-based observable inputs, including
interest rate curves, HP and counterparty credit risk, foreign exchange rates, and forward and spot
prices for currencies and interest rates. See Note 11 for a further discussion of HP’s use of derivative
instruments.
140