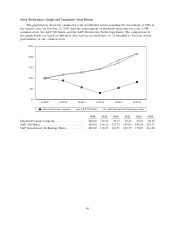
HP 2014 Annual Report Download - page 51
Download and view the complete annual report
Please find page 51 of the 2014 HP annual report below. You can navigate through the pages in the report by either clicking on the pages listed below, or by using the keyword search tool below to find specific information within the annual report.-
 1
1 -
2
-
3
-
4
-
5
-
6
-
7
-
8
-
9
-
10
-
11
-
12
-
13
-
14
-
15
-
16
-
17
-
18
-
19
-
20
-
21
-
22
-
23
-
24
-
25
-
26
-
27
-
28
-
29
-
30
-
31
-
32
-
33
-
34
-
35
-
36
-
37
-
38
-
39
-
40
-
 41
41 -
 42
42 -
 43
43 -
 44
44 -
 45
45 -
 46
46 -
 47
47 -
 48
48 -
 49
49 -
 50
50 -
 51
51 -
 52
52 -
 53
53 -
 54
54 -
 55
55 -
 56
56 -
 57
57 -
 58
58 -
 59
59 -
 60
60 -
 61
61 -
62
-
63
-
64
-
65
-
66
-
67
-
68
-
69
-
70
-
71
-
72
-
73
-
74
-
75
-
76
-
77
-
78
-
79
-
80
-
81
-
82
-
83
-
84
-
85
-
86
-
87
-
88
-
89
-
90
-
91
-
92
-
93
-
94
-
95
-
96
-
97
-
98
-
99
-
100
-
101
-
102
-
103
-
104
-
105
-
106
-
107
-
108
-
109
-
110
-
111
-
112
-
113
-
114
-
115
-
116
-
117
-
118
-
119
-
120
-
121
-
122
-
123
-
124
-
125
-
126
-
127
-
128
-
129
-
130
-
131
-
132
-
133
-
134
-
135
-
136
-
137
-
138
-
139
-
140
-
141
-
142
-
143
-
144
-
145
-
146
-
147
-
148
-
149
-
150
-
151
-
152
-
153
-
154
-
155
-
156
-
157
-
158
-
159
-
160
-
161
-
162
-
163
-
164
-
165
-
166
-
167
-
168
-
169
-
170
-
171
-
172
-
173
-
174
-
175
-
176
-
177
-
178
-
179
-
180
-
181
-
182
-
183
-
184
-
185
-
186
-
187
-
188
-
189
-
190
-
191
-
192
-
193
-
194
-
195
-
196
 |
 |

5DEC201423560915
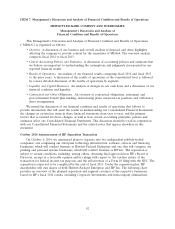
HEWLETT-PACKARD COMPANY AND SUBSIDIARIES
Management’s Discussion and Analysis of
Financial Condition and Results of Operations (Continued)
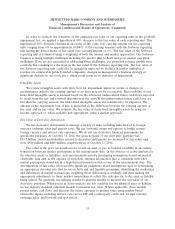
Hewlett-Packard Enterprise
Revenue Mix
(based on
fiscal 2014 results)
Financial Metrics
HP Inc.
Enterprise Group 48%
Financial Services
• Segment Revenue: $57.6B • Segment Revenue: $57.3B
6%
Software 7%
Enterprise Services 39%
Printing 40%
Personal Systems 60%
The following Overview, Results of Operations and Liquidity discussions and analysis compare
fiscal 2014 to fiscal 2013 and fiscal 2013 to fiscal 2012, unless otherwise noted. The Capital Resources
and Contractual and Other Obligations discussions present information as of October 31, 2014, unless
otherwise noted.
OVERVIEW
We are a leading global provider of products, technologies, software, solutions and services to
individual consumers, small- and medium-sized businesses (‘‘SMBs’’) and large enterprises, including
customers in the government, health and education sectors. Our offerings span the following: personal
computing and other access devices; imaging- and printing-related products and services; enterprise
information technology (‘‘IT’’) infrastructure, including enterprise server and storage technology,
networking products and solutions, technology support and maintenance; multi-vendor customer
services, including technology consulting, outsourcing and support services across infrastructure,
applications and business process domains; and IT management software, application testing and
delivery software, information management solutions, big data analytics and security intelligence/risk
management solutions. We have seven segments for financial reporting purposes: Personal Systems,
Printing, the Enterprise Group (‘‘EG’’), Enterprise Services (‘‘ES’’), Software, HP Financial Services
(‘‘HPFS’’) and Corporate Investments.
43