HP 2014 Annual Report Download - page 112
Download and view the complete annual report
Please find page 112 of the 2014 HP annual report below. You can navigate through the pages in the report by either clicking on the pages listed below, or by using the keyword search tool below to find specific information within the annual report.-
 1
1 -
2
-
3
-
4
-
5
-
6
-
7
-
8
-
9
-
10
-
11
-
12
-
13
-
14
-
15
-
16
-
17
-
18
-
19
-
20
-
21
-
22
-
23
-
24
-
25
-
26
-
27
-
28
-
29
-
30
-
31
-
32
-
33
-
34
-
35
-
36
-
37
-
38
-
39
-
40
-
41
-
42
-
43
-
44
-
45
-
46
-
47
-
48
-
49
-
50
-
51
-
52
-
53
-
54
-
55
-
56
-
57
-
58
-
59
-
60
-
61
-
62
-
63
-
64
-
65
-
66
-
67
-
68
-
69
-
70
-
71
-
72
-
73
-
74
-
75
-
76
-
77
-
78
-
79
-
80
-
81
-
82
-
83
-
84
-
85
-
86
-
87
-
88
-
89
-
90
-
91
-
92
-
93
-
94
-
95
-
96
-
97
-
98
-
99
-
100
-
101
-
 102
102 -
 103
103 -
 104
104 -
 105
105 -
 106
106 -
 107
107 -
 108
108 -
 109
109 -
 110
110 -
 111
111 -
 112
112 -
 113
113 -
 114
114 -
 115
115 -
 116
116 -
 117
117 -
 118
118 -
 119
119 -
 120
120 -
 121
121 -
 122
122 -
123
-
124
-
125
-
126
-
127
-
128
-
129
-
130
-
131
-
132
-
133
-
134
-
135
-
136
-
137
-
138
-
139
-
140
-
141
-
142
-
143
-
144
-
145
-
146
-
147
-
148
-
149
-
150
-
151
-
152
-
153
-
154
-
155
-
156
-
157
-
158
-
159
-
160
-
161
-
162
-
163
-
164
-
165
-
166
-
167
-
168
-
169
-
170
-
171
-
172
-
173
-
174
-
175
-
176
-
177
-
178
-
179
-
180
-
181
-
182
-
183
-
184
-
185
-
186
-
187
-
188
-
189
-
190
-
191
-
192
-
193
-
194
-
195
-
196
 |
 |

HEWLETT-PACKARD COMPANY AND SUBSIDIARIES
Notes to Consolidated Financial Statements (Continued)
Note 2: Segment Information (Continued)
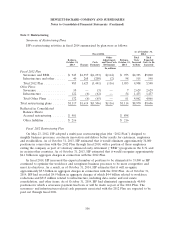
Segment Assets
HP allocates assets to its business segments based on the segments primarily benefiting from the
assets. Total assets by segment and the reconciliation of segment assets to HP consolidated assets were
as follows:
As of October 31
2014 2013(1)
In millions
Personal Systems ............................................... $ 12,104 $ 11,690
Printing ...................................................... 10,063 11,088
Printing and Personal Systems Group .............................. 22,167 22,778
Enterprise Group .............................................. 27,236 29,759
Enterprise Services ............................................. 13,472 16,217
Software ..................................................... 11,575 11,940
HP Financial Services ........................................... 13,529 12,746
Corporate Investments ........................................... 34 105
Corporate and unallocated assets ................................... 15,193 12,131
Total HP consolidated assets ................................... $103,206 $105,676
(1) HP has revised the presentation for the fiscal year ended October 31, 2013 in order to present
comparable information with the current year period.
Major Customers
No single customer represented 10% or more of HP’s total net revenue in any fiscal year
presented.
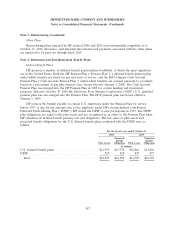
Geographic Information
Net revenue by country is based upon the sales location that predominately represents the
customer location. For each of the fiscal years of 2014, 2013 and 2012, other than the U.S., no country
represented more than 10% of HP net revenue.
Net revenue by country in which HP operates was as follows:
For the fiscal years ended October 31
2014 2013 2012
In millions
U.S................................................. $ 38,805 $ 40,284 $ 42,140
Other countries ........................................ 72,649 72,014 78,217
Total net revenue ..................................... $111,454 $112,298 $120,357
As of October 31, 2014, the U.S., Netherlands and Ireland each represented more than 10% of net
assets. As of October 31, 2013, the U.S., the Cayman Islands and Ireland each represented 10% or
more of net assets.
104