HP 2014 Annual Report Download - page 155
Download and view the complete annual report
Please find page 155 of the 2014 HP annual report below. You can navigate through the pages in the report by either clicking on the pages listed below, or by using the keyword search tool below to find specific information within the annual report.-
 1
1 -
 2
2 -
 3
3 -
 4
4 -
 5
5 -
 6
6 -
 7
7 -
 8
8 -
 9
9 -
 10
10 -
 11
11 -
 12
12 -
 13
13 -
 14
14 -
 15
15 -
 16
16 -
 17
17 -
 18
18 -
 19
19 -
 20
20 -
 21
21 -
 22
22 -
 23
23 -
 24
24 -
 25
25 -
 26
26 -
 27
27 -
 28
28 -
 29
29 -
 30
30 -
 31
31 -
 32
32 -
 33
33 -
 34
34 -
 35
35 -
 36
36 -
 37
37 -
 38
38 -
 39
39 -
 40
40 -
 41
41 -
 42
42 -
 43
43 -
 44
44 -
 45
45 -
 46
46 -
 47
47 -
 48
48 -
 49
49 -
 50
50 -
 51
51 -
 52
52 -
 53
53 -
 54
54 -
 55
55 -
 56
56 -
 57
57 -
 58
58 -
 59
59 -
 60
60 -
 61
61 -
 62
62 -
 63
63 -
 64
64 -
 65
65 -
 66
66 -
 67
67 -
 68
68 -
 69
69 -
 70
70 -
 71
71 -
 72
72 -
 73
73 -
 74
74 -
 75
75 -
 76
76 -
 77
77 -
 78
78 -
 79
79 -
 80
80 -
 81
81 -
 82
82 -
 83
83 -
 84
84 -
 85
85 -
 86
86 -
 87
87 -
 88
88 -
 89
89 -
 90
90 -
 91
91 -
 92
92 -
 93
93 -
 94
94 -
 95
95 -
 96
96 -
 97
97 -
 98
98 -
 99
99 -
 100
100 -
 101
101 -
 102
102 -
 103
103 -
 104
104 -
 105
105 -
 106
106 -
 107
107 -
 108
108 -
 109
109 -
 110
110 -
 111
111 -
 112
112 -
 113
113 -
 114
114 -
 115
115 -
 116
116 -
 117
117 -
 118
118 -
 119
119 -
 120
120 -
 121
121 -
 122
122 -
 123
123 -
 124
124 -
 125
125 -
 126
126 -
 127
127 -
 128
128 -
 129
129 -
 130
130 -
 131
131 -
 132
132 -
 133
133 -
 134
134 -
 135
135 -
 136
136 -
 137
137 -
 138
138 -
 139
139 -
 140
140 -
 141
141 -
 142
142 -
 143
143 -
 144
144 -
 145
145 -
 146
146 -
 147
147 -
 148
148 -
 149
149 -
 150
150 -
 151
151 -
 152
152 -
 153
153 -
 154
154 -
 155
155 -
 156
156 -
 157
157 -
 158
158 -
 159
159 -
 160
160 -
 161
161 -
 162
162 -
 163
163 -
 164
164 -
 165
165 -
 166
166 -
 167
167 -
 168
168 -
 169
169 -
 170
170 -
 171
171 -
 172
172 -
 173
173 -
 174
174 -
 175
175 -
 176
176 -
 177
177 -
 178
178 -
 179
179 -
 180
180 -
 181
181 -
 182
182 -
 183
183 -
 184
184 -
 185
185 -
 186
186 -
 187
187 -
 188
188 -
 189
189 -
 190
190 -
 191
191 -
 192
192 -
 193
193 -
 194
194 -
 195
195 -
 196
196
 |
 |

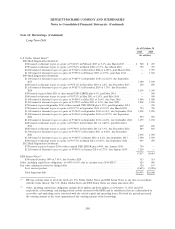
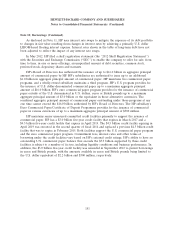
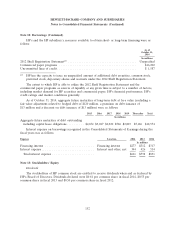
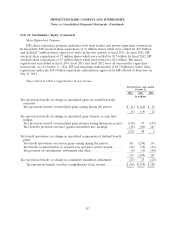
HEWLETT-PACKARD COMPANY AND SUBSIDIARIES
Notes to Consolidated Financial Statements (Continued)
Note 11: Financial Instruments (Continued)
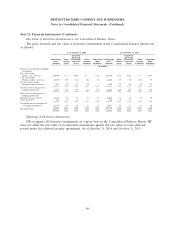
information related to the potential effect of HP’s master netting agreements and collateral security
agreements was as follows:
As of October 31, 2014
In the Consolidated Balance Sheets
(i) (ii) (iii) = (i)ᎈ(ii) (iv) (v) (vi) = (iii)ᎈ(iv)ᎈ(v)
Gross Amounts
Not Offset
Gross Gross
Amount Amount Net Amount Financial
Recognized Offset Presented Derivatives Collateral Net Amount
In millions
Derivative assets ............. $980 $— $980 $361 $452 $167
Derivative liabilities ........... $405 $— $405 $361 $ 29(1) $15
(1) Collateral posted through re-use of counterparty cash collateral.
As of October 31, 2013
In the Consolidated Balance Sheets
(i) (ii) (iii) = (i)ᎈ(ii) (iv) (v) (vi) = (iii)ᎈ(iv)ᎈ(v)
Gross Amounts
Not Offset
Gross Gross
Amount Amount Net Amount Financial
Recognized Offset Presented Derivatives Collateral Net Amount
In millions
Derivative assets ....... $452 $— $452 $372 $ 30 $50
Derivative liabilities ..... $656 $— $656 $372 $283(1) $1
(1) Of the $283 million of collateral posted, $30 million was through re-use of counterparty cash
collateral and $253 million was in cash.
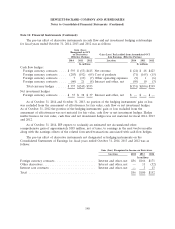
Effect of Derivative Instruments on the Consolidated Statements of Earnings
The pre-tax effect of derivative instruments and related hedged items in a fair value hedging
relationship for fiscal years ended October 31, 2014, 2013 and 2012 was as follows:
(Loss) Gain Recognized in Income on Derivative and Related Hedged Item
Derivative Instrument Location 2014 2013 2012 Hedged Item Location 2014 2013 2012
In millions In millions
Interest rate contracts . . Interest and other, net $1 $(270) $(130) Fixed-rate debt Interest and other, net $(1) $270 $134
147
