HP 2014 Annual Report Download - page 92
Download and view the complete annual report
Please find page 92 of the 2014 HP annual report below. You can navigate through the pages in the report by either clicking on the pages listed below, or by using the keyword search tool below to find specific information within the annual report.-
 1
1 -
 2
2 -
 3
3 -
 4
4 -
 5
5 -
 6
6 -
 7
7 -
 8
8 -
 9
9 -
 10
10 -
 11
11 -
 12
12 -
 13
13 -
 14
14 -
 15
15 -
 16
16 -
 17
17 -
 18
18 -
 19
19 -
 20
20 -
 21
21 -
 22
22 -
 23
23 -
 24
24 -
 25
25 -
 26
26 -
 27
27 -
 28
28 -
 29
29 -
 30
30 -
 31
31 -
 32
32 -
 33
33 -
 34
34 -
 35
35 -
 36
36 -
 37
37 -
 38
38 -
 39
39 -
 40
40 -
 41
41 -
 42
42 -
 43
43 -
 44
44 -
 45
45 -
 46
46 -
 47
47 -
 48
48 -
 49
49 -
 50
50 -
 51
51 -
 52
52 -
 53
53 -
 54
54 -
 55
55 -
 56
56 -
 57
57 -
 58
58 -
 59
59 -
 60
60 -
 61
61 -
 62
62 -
 63
63 -
 64
64 -
 65
65 -
 66
66 -
 67
67 -
 68
68 -
 69
69 -
 70
70 -
 71
71 -
 72
72 -
 73
73 -
 74
74 -
 75
75 -
 76
76 -
 77
77 -
 78
78 -
 79
79 -
 80
80 -
 81
81 -
 82
82 -
 83
83 -
 84
84 -
 85
85 -
 86
86 -
 87
87 -
 88
88 -
 89
89 -
 90
90 -
 91
91 -
 92
92 -
 93
93 -
 94
94 -
 95
95 -
 96
96 -
 97
97 -
 98
98 -
 99
99 -
 100
100 -
 101
101 -
 102
102 -
 103
103 -
 104
104 -
 105
105 -
 106
106 -
 107
107 -
 108
108 -
 109
109 -
 110
110 -
 111
111 -
 112
112 -
 113
113 -
 114
114 -
 115
115 -
 116
116 -
 117
117 -
 118
118 -
 119
119 -
 120
120 -
 121
121 -
 122
122 -
 123
123 -
 124
124 -
 125
125 -
 126
126 -
 127
127 -
 128
128 -
 129
129 -
 130
130 -
 131
131 -
 132
132 -
 133
133 -
 134
134 -
 135
135 -
 136
136 -
 137
137 -
 138
138 -
 139
139 -
 140
140 -
 141
141 -
 142
142 -
 143
143 -
 144
144 -
 145
145 -
 146
146 -
 147
147 -
 148
148 -
 149
149 -
 150
150 -
 151
151 -
 152
152 -
 153
153 -
 154
154 -
 155
155 -
 156
156 -
 157
157 -
 158
158 -
 159
159 -
 160
160 -
 161
161 -
 162
162 -
 163
163 -
 164
164 -
 165
165 -
 166
166 -
 167
167 -
 168
168 -
 169
169 -
 170
170 -
 171
171 -
 172
172 -
 173
173 -
 174
174 -
 175
175 -
 176
176 -
 177
177 -
 178
178 -
 179
179 -
 180
180 -
 181
181 -
 182
182 -
 183
183 -
 184
184 -
 185
185 -
 186
186 -
 187
187 -
 188
188 -
 189
189 -
 190
190 -
 191
191 -
 192
192 -
 193
193 -
 194
194 -
 195
195 -
 196
196
 |
 |

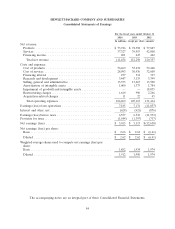
HEWLETT-PACKARD COMPANY AND SUBSIDIARIES
Consolidated Statements of Earnings
For the fiscal years ended October 31
2014 2013 2012
In millions, except per share amounts
Net revenue:
Products ........................................... $ 73,726 $ 72,398 $ 77,887
Services ............................................ 37,327 39,453 42,008
Financing income ..................................... 401 447 462
Total net revenue ................................... 111,454 112,298 120,357
Costs and expenses:
Cost of products ..................................... 56,469 55,632 59,468
Cost of services ...................................... 28,093 30,436 32,600
Financing interest .................................... 277 312 317
Research and development .............................. 3,447 3,135 3,399
Selling, general and administrative ........................ 13,353 13,267 13,500
Amortization of intangible assets ......................... 1,000 1,373 1,784
Impairment of goodwill and intangible assets ................. — — 18,035
Restructuring charges .................................. 1,619 990 2,266
Acquisition-related charges .............................. 11 22 45
Total operating expenses .............................. 104,269 105,167 131,414
Earnings (loss) from operations ............................ 7,185 7,131 (11,057)
Interest and other, net ................................... (628) (621) (876)
Earnings (loss) before taxes ............................... 6,557 6,510 (11,933)
Provision for taxes ...................................... (1,544) (1,397) (717)
Net earnings (loss) ..................................... $ 5,013 $ 5,113 $(12,650)
Net earnings (loss) per share:
Basic .............................................. $ 2.66 $ 2.64 $ (6.41)
Diluted ............................................ $ 2.62 $ 2.62 $ (6.41)
Weighted-average shares used to compute net earnings (loss) per
share:
Basic .............................................. 1,882 1,934 1,974
Diluted ............................................ 1,912 1,950 1,974
The accompanying notes are an integral part of these Consolidated Financial Statements.
84
