HP 2014 Annual Report Download - page 124
Download and view the complete annual report
Please find page 124 of the 2014 HP annual report below. You can navigate through the pages in the report by either clicking on the pages listed below, or by using the keyword search tool below to find specific information within the annual report.-
 1
1 -
2
-
3
-
4
-
5
-
6
-
7
-
8
-
9
-
10
-
11
-
12
-
13
-
14
-
15
-
16
-
17
-
18
-
19
-
20
-
21
-
22
-
23
-
24
-
25
-
26
-
27
-
28
-
29
-
30
-
31
-
32
-
33
-
34
-
35
-
36
-
37
-
38
-
39
-
40
-
41
-
42
-
43
-
44
-
45
-
46
-
47
-
48
-
49
-
50
-
51
-
52
-
53
-
54
-
55
-
56
-
57
-
58
-
59
-
60
-
61
-
62
-
63
-
64
-
65
-
66
-
67
-
68
-
69
-
70
-
71
-
72
-
73
-
74
-
75
-
76
-
77
-
78
-
79
-
80
-
81
-
82
-
83
-
84
-
85
-
86
-
87
-
88
-
89
-
90
-
91
-
92
-
93
-
94
-
95
-
96
-
97
-
98
-
99
-
100
-
101
-
102
-
103
-
104
-
105
-
106
-
107
-
108
-
109
-
110
-
111
-
112
-
113
-
 114
114 -
 115
115 -
 116
116 -
 117
117 -
 118
118 -
 119
119 -
 120
120 -
 121
121 -
 122
122 -
 123
123 -
 124
124 -
 125
125 -
 126
126 -
 127
127 -
 128
128 -
 129
129 -
 130
130 -
 131
131 -
 132
132 -
 133
133 -
 134
134 -
135
-
136
-
137
-
138
-
139
-
140
-
141
-
142
-
143
-
144
-
145
-
146
-
147
-
148
-
149
-
150
-
151
-
152
-
153
-
154
-
155
-
156
-
157
-
158
-
159
-
160
-
161
-
162
-
163
-
164
-
165
-
166
-
167
-
168
-
169
-
170
-
171
-
172
-
173
-
174
-
175
-
176
-
177
-
178
-
179
-
180
-
181
-
182
-
183
-
184
-
185
-
186
-
187
-
188
-
189
-
190
-
191
-
192
-
193
-
194
-
195
-
196
 |
 |

HEWLETT-PACKARD COMPANY AND SUBSIDIARIES
Notes to Consolidated Financial Statements (Continued)
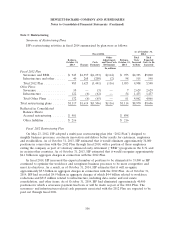
Note 4: Retirement and Post-Retirement Benefit Plans (Continued)
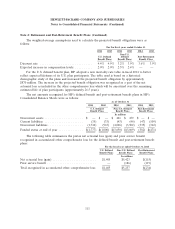
to the absence of quoted market prices, and these assets are generally classified in Level 2 of the fair
value hierarchy. Cash and cash equivalents includes money market funds, which are valued based on
NAV. Other assets, including insurance group annuity contracts, were classified in the fair value
hierarchy based on the lowest level input (e.g., quoted prices and observable inputs) that is significant
to the fair value measure in its entirety.
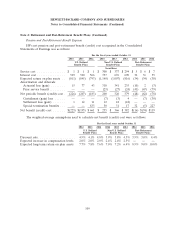
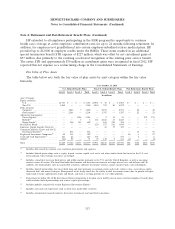
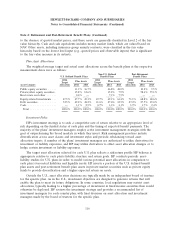
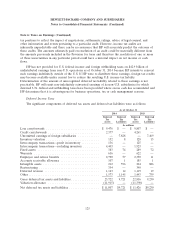
Plan Asset Allocations
The weighted-average target and actual asset allocations across the benefit plans at the respective
measurement dates were as follows:
Non-U.S. Defined Post-Retirement
U.S. Defined Benefit Plans Benefit Plans Benefit Plans
2014 2014 2014
Plan Assets Plan Assets Plan Assets
Target Target Target
Asset Category Allocation 2014 2013 Allocation 2014 2013 Allocation 2014 2013
Public equity securities ..... 31.3% 36.7% 46.8% 48.0% 10.2% 9.5%
Private/other equity securities . 15.8% 12.6% 15.2% 7.9% 58.6% 59.1%
Real estate and other ...... 0.6% — 7.1% 7.5% — —
Equity-related investments . . . 47.5% 47.7% 49.3% 67.7% 69.1% 63.4% 71.1% 68.8% 68.6%
Debt securities ........... 52.5% 49.2% 48.2% 31.6% 27.6% 32.5% 27.0% 27.5% 29.0%
Cash .................. — 3.1% 2.5% 0.7% 3.3% 4.1% 1.9% 3.7% 2.4%
Total ................ 100.0% 100.0% 100.0% 100.0% 100.0% 100.0% 100.0% 100.0% 100.0%
Investment Policy
HP’s investment strategy is to seek a competitive rate of return relative to an appropriate level of
risk depending on the funded status of each plan and the timing of expected benefit payments. The
majority of the plans’ investment managers employ active investment management strategies with the
goal of outperforming the broad markets in which they invest. Risk management practices include
diversification across asset classes and investment styles and periodic rebalancing toward asset
allocation targets. A number of the plans’ investment managers are authorized to utilize derivatives for
investment or liability exposures, and HP may utilize derivatives to effect asset allocation changes or to
hedge certain investment or liability exposures.
The target asset allocation selected for each U.S. plan reflects a risk/return profile HP believes is
appropriate relative to each plan’s liability structure and return goals. HP conducts periodic asset-
liability studies for U.S. plans in order to model various potential asset allocations in comparison to
each plan’s forecasted liabilities and liquidity needs. HP invests a portion of the U.S. defined benefit
plan assets and post-retirement benefit plan assets in private market securities such as private equity
funds to provide diversification and a higher expected return on assets.
Outside the U.S., asset allocation decisions are typically made by an independent board of trustees
for the specific plan. As in the U.S., investment objectives are designed to generate returns that will
enable the plan to meet its future obligations. In some countries, local regulations may restrict asset
allocations, typically leading to a higher percentage of investment in fixed income securities than would
otherwise be deployed. HP reviews the investment strategy and provides a recommended list of
investment managers for each country plan, with final decisions on asset allocation and investment
managers made by the board of trustees for the specific plan.
116