HP 2014 Annual Report Download - page 64
Download and view the complete annual report
Please find page 64 of the 2014 HP annual report below. You can navigate through the pages in the report by either clicking on the pages listed below, or by using the keyword search tool below to find specific information within the annual report.-
 1
1 -
2
-
3
-
4
-
5
-
6
-
7
-
8
-
9
-
10
-
11
-
12
-
13
-
14
-
15
-
16
-
17
-
18
-
19
-
20
-
21
-
22
-
23
-
24
-
25
-
26
-
27
-
28
-
29
-
30
-
31
-
32
-
33
-
34
-
35
-
36
-
37
-
38
-
39
-
40
-
41
-
42
-
43
-
44
-
45
-
46
-
47
-
48
-
49
-
50
-
51
-
52
-
53
-
 54
54 -
 55
55 -
 56
56 -
 57
57 -
 58
58 -
 59
59 -
 60
60 -
 61
61 -
 62
62 -
 63
63 -
 64
64 -
 65
65 -
 66
66 -
 67
67 -
 68
68 -
 69
69 -
 70
70 -
 71
71 -
 72
72 -
 73
73 -
 74
74 -
75
-
76
-
77
-
78
-
79
-
80
-
81
-
82
-
83
-
84
-
85
-
86
-
87
-
88
-
89
-
90
-
91
-
92
-
93
-
94
-
95
-
96
-
97
-
98
-
99
-
100
-
101
-
102
-
103
-
104
-
105
-
106
-
107
-
108
-
109
-
110
-
111
-
112
-
113
-
114
-
115
-
116
-
117
-
118
-
119
-
120
-
121
-
122
-
123
-
124
-
125
-
126
-
127
-
128
-
129
-
130
-
131
-
132
-
133
-
134
-
135
-
136
-
137
-
138
-
139
-
140
-
141
-
142
-
143
-
144
-
145
-
146
-
147
-
148
-
149
-
150
-
151
-
152
-
153
-
154
-
155
-
156
-
157
-
158
-
159
-
160
-
161
-
162
-
163
-
164
-
165
-
166
-
167
-
168
-
169
-
170
-
171
-
172
-
173
-
174
-
175
-
176
-
177
-
178
-
179
-
180
-
181
-
182
-
183
-
184
-
185
-
186
-
187
-
188
-
189
-
190
-
191
-
192
-
193
-
194
-
195
-
196
 |
 |

HEWLETT-PACKARD COMPANY AND SUBSIDIARIES
Management’s Discussion and Analysis of
Financial Condition and Results of Operations (Continued)
Fiscal 2014 compared with Fiscal 2013
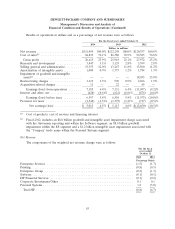
In fiscal 2014, total HP net revenue declined 0.8% (decreased 0.4% on a constant currency basis)
as compared with fiscal 2013. U.S. net revenue decreased 3.7% to $38.8 billion, while net revenue from
outside of the U.S. increased 0.9% to $72.6 billion. The leading contributors to the HP net revenue
decline were key account runoff in ES and lower Printing supplies volume. Partially offsetting the net
revenue decline was growth in Personal Systems from commercial PCs, which experienced growth
across all product categories, along with growth in consumer notebooks.
From a segment perspective, the primary factors contributing to the change in HP net revenue for
fiscal 2014 compared with fiscal 2013 are summarized as follows:
• ES net revenue declined due primarily to revenue runoff in key accounts, weak growth in new
and existing accounts, particularly in EMEA, and contractual price declines;
• Printing net revenue decreased due primarily to a decline in Supplies;
• EG net revenue decreased due to net revenue declines in TS, BCS and Storage;
• Software net revenue decreased due to lower net revenue from licenses, support and
professional services;
• HPFS net revenue decreased due primarily to lower portfolio revenue from lower average
portfolio assets and lower asset management activity, primarily in customer buyouts;
• Corporate Investments net revenue increased due to the sale of intellectual property (‘‘IP’’); and
• Personal Systems net revenue increased due to growth in commercial PCs, particularly
notebooks, along with growth in consumer notebooks.
Fiscal 2013 compared with Fiscal 2012
In fiscal 2013, total HP net revenue declined 6.7% (decreased 5.5% on a constant currency basis)
as compared with fiscal 2012. U.S. net revenue decreased 4.4% to $40.3 billion, while net revenue from
outside of the U.S. decreased 7.9% to $72.0 billion. The net revenue decline was due primarily to
declines of approximately 10%, 7%, 5% and 3% in our Personal Systems, ES, EG and Printing
segments, respectively.
From a segment perspective, the primary factors contributing to the change in HP net revenue for
fiscal 2013 compared with fiscal 2012 are summarized as follows:
• Personal Systems net revenue declined due to the decline in the overall PC market as a result of
a customer shift, particularly consumers, to tablet products;
• ES net revenue declined due primarily to net service revenue runoff and contractual price
declines in ongoing contracts due in part to weak public sector spending and enterprise IT
demand;
• EG net revenue declined due to multiple factors, including competitive pricing challenges in ISS,
a market decline for UNIX products impacting BCS, declines in TS due in part to lower support
for BCS products, product transitions in Storage and overall weak enterprise IT demand;
• Printing net revenue declined due to unfavorable currency impacts, particularly the euro, and
declines in supplies and commercial printers;
56