HP 2014 Annual Report Download - page 80
Download and view the complete annual report
Please find page 80 of the 2014 HP annual report below. You can navigate through the pages in the report by either clicking on the pages listed below, or by using the keyword search tool below to find specific information within the annual report.-
 1
1 -
2
-
3
-
4
-
5
-
6
-
7
-
8
-
9
-
10
-
11
-
12
-
13
-
14
-
15
-
16
-
17
-
18
-
19
-
20
-
21
-
22
-
23
-
24
-
25
-
26
-
27
-
28
-
29
-
30
-
31
-
32
-
33
-
34
-
35
-
36
-
37
-
38
-
39
-
40
-
41
-
42
-
43
-
44
-
45
-
46
-
47
-
48
-
49
-
50
-
51
-
52
-
53
-
54
-
55
-
56
-
57
-
58
-
59
-
60
-
61
-
62
-
63
-
64
-
65
-
66
-
67
-
68
-
69
-
 70
70 -
 71
71 -
 72
72 -
 73
73 -
 74
74 -
 75
75 -
 76
76 -
 77
77 -
 78
78 -
 79
79 -
 80
80 -
 81
81 -
 82
82 -
 83
83 -
 84
84 -
 85
85 -
 86
86 -
 87
87 -
 88
88 -
 89
89 -
 90
90 -
91
-
92
-
93
-
94
-
95
-
96
-
97
-
98
-
99
-
100
-
101
-
102
-
103
-
104
-
105
-
106
-
107
-
108
-
109
-
110
-
111
-
112
-
113
-
114
-
115
-
116
-
117
-
118
-
119
-
120
-
121
-
122
-
123
-
124
-
125
-
126
-
127
-
128
-
129
-
130
-
131
-
132
-
133
-
134
-
135
-
136
-
137
-
138
-
139
-
140
-
141
-
142
-
143
-
144
-
145
-
146
-
147
-
148
-
149
-
150
-
151
-
152
-
153
-
154
-
155
-
156
-
157
-
158
-
159
-
160
-
161
-
162
-
163
-
164
-
165
-
166
-
167
-
168
-
169
-
170
-
171
-
172
-
173
-
174
-
175
-
176
-
177
-
178
-
179
-
180
-
181
-
182
-
183
-
184
-
185
-
186
-
187
-
188
-
189
-
190
-
191
-
192
-
193
-
194
-
195
-
196
 |
 |

HEWLETT-PACKARD COMPANY AND SUBSIDIARIES
Management’s Discussion and Analysis of
Financial Condition and Results of Operations (Continued)
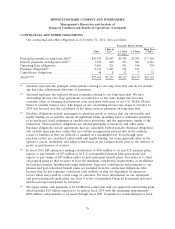
Amounts held outside of the U.S. are generally utilized to support non-U.S. liquidity needs,
although a portion of those amounts may from time to time be subject to short-term intercompany
loans into the U.S. Most of the amounts held outside of the U.S. could be repatriated to the U.S. but,
under current law, some would be subject to U.S. federal income taxes, less applicable foreign tax
credits. Repatriation of some foreign earnings is restricted by local law. Except for foreign earnings that
are considered indefinitely reinvested outside of the U.S., we have provided for the U.S. federal tax
liability on these earnings for financial statement purposes. Repatriation could result in additional
income tax payments in future years. Where local restrictions prevent an efficient intercompany transfer
of funds, our intent is that cash balances would remain outside of the U.S. and we would meet liquidity
needs through ongoing cash flows, external borrowings, or both. We do not expect restrictions or
potential taxes incurred on repatriation of amounts held outside of the U.S. to have a material effect
on our overall liquidity, financial condition or results of operations.
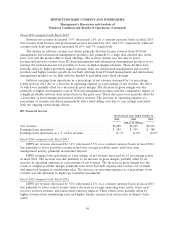
Liquidity
Our cash and cash equivalents, total debt and available borrowing resources were as follows:
As of October 31
2014 2013 2012
In billions
Cash and cash equivalents ....................................... $15.1 $12.2 $11.3
Total debt ................................................... $19.5 $22.6 $28.4
Available borrowing resources(1) ................................... $17.8 $17.8 $17.4
(1) In addition to these available borrowing resources, we are able to offer for sale, from time to time,
in one or more offerings, an unspecified amount of debt securities, common stock, preferred stock,
depositary shares and warrants under a shelf registration statement filed with the Securities and
Exchange Commission in May 2012 (the ‘‘2012 Shelf Registration Statement’’).
Our key cash flow metrics were as follows:
For the fiscal years ended
October 31
2014 2013 2012
In millions
Net cash provided by operating activities ........................ $12,333 $11,608 $10,571
Net cash used in investing activities ............................ (2,792) (2,803) (3,453)
Net cash used in financing activities ........................... (6,571) (7,943) (3,860)
Net increase in cash and cash equivalents ...................... $ 2,970 $ 862 $ 3,258
Operating Activities
Net cash provided by operating activities increased by $0.7 billion for fiscal 2014 as compared to
fiscal 2013, due primarily to improvements in working capital management. Net cash provided by
operating activities increased by $1.0 billion for fiscal 2013 compared to fiscal 2012, due primarily to
improvements in working capital management and a reduction in payments associated with webOS
contract cancellations.
72