HP 2014 Annual Report Download - page 82
Download and view the complete annual report
Please find page 82 of the 2014 HP annual report below. You can navigate through the pages in the report by either clicking on the pages listed below, or by using the keyword search tool below to find specific information within the annual report.-
 1
1 -
2
-
3
-
4
-
5
-
6
-
7
-
8
-
9
-
10
-
11
-
12
-
13
-
14
-
15
-
16
-
17
-
18
-
19
-
20
-
21
-
22
-
23
-
24
-
25
-
26
-
27
-
28
-
29
-
30
-
31
-
32
-
33
-
34
-
35
-
36
-
37
-
38
-
39
-
40
-
41
-
42
-
43
-
44
-
45
-
46
-
47
-
48
-
49
-
50
-
51
-
52
-
53
-
54
-
55
-
56
-
57
-
58
-
59
-
60
-
61
-
62
-
63
-
64
-
65
-
66
-
67
-
68
-
69
-
70
-
71
-
 72
72 -
 73
73 -
 74
74 -
 75
75 -
 76
76 -
 77
77 -
 78
78 -
 79
79 -
 80
80 -
 81
81 -
 82
82 -
 83
83 -
 84
84 -
 85
85 -
 86
86 -
 87
87 -
 88
88 -
 89
89 -
 90
90 -
 91
91 -
 92
92 -
93
-
94
-
95
-
96
-
97
-
98
-
99
-
100
-
101
-
102
-
103
-
104
-
105
-
106
-
107
-
108
-
109
-
110
-
111
-
112
-
113
-
114
-
115
-
116
-
117
-
118
-
119
-
120
-
121
-
122
-
123
-
124
-
125
-
126
-
127
-
128
-
129
-
130
-
131
-
132
-
133
-
134
-
135
-
136
-
137
-
138
-
139
-
140
-
141
-
142
-
143
-
144
-
145
-
146
-
147
-
148
-
149
-
150
-
151
-
152
-
153
-
154
-
155
-
156
-
157
-
158
-
159
-
160
-
161
-
162
-
163
-
164
-
165
-
166
-
167
-
168
-
169
-
170
-
171
-
172
-
173
-
174
-
175
-
176
-
177
-
178
-
179
-
180
-
181
-
182
-
183
-
184
-
185
-
186
-
187
-
188
-
189
-
190
-
191
-
192
-
193
-
194
-
195
-
196
 |
 |

HEWLETT-PACKARD COMPANY AND SUBSIDIARIES
Management’s Discussion and Analysis of
Financial Condition and Results of Operations (Continued)
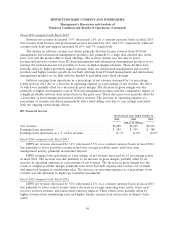
Capital Resources
Debt Levels
As of October 31
2014 2013 2012
Dollars in millions
Short-term debt ........................................ $ 3,486 $ 5,979 $ 6,647
Long-term debt ........................................ $16,039 $16,608 $21,789
Debt-to-equity ratio ..................................... 0.72x 0.82x 1.25x
Weighted-average interest rate ............................. 2.7% 3.0% 3.0%
We maintain debt levels that we establish through consideration of a number of factors, including
cash flow expectations, cash requirements for operations, investment plans (including acquisitions),
share repurchase activities, our cost of capital and targeted capital structure.
Short-term debt and long-term debt decreased by $2.5 billion and $0.6 billion, respectively, for
fiscal 2014 as compared to fiscal 2013. The net decrease in total debt was due primarily to maturities of
debt. During fiscal 2014, we issued $2.0 billion of U.S. Dollar Global Notes under the 2012 Shelf
Registration Statement which mature in 2019 and repaid $4.9 billion of U.S. Dollar Global Notes. We
also issued $11.6 billion and repaid $11.5 billion of commercial paper in fiscal 2014. Short-term debt
and long-term debt decreased by $0.6 billion and $5.2 billion, respectively, for fiscal 2013 as compared
to fiscal 2012. Both net decreases were due primarily to maturities of debt and net repayments of
commercial paper. The issuances and repayments of commercial paper were $16.1 billion and
$16.2 billion in fiscal 2013 and $12.2 billion and $15.0 billion in fiscal 2012, respectively.
During fiscal 2015, $2.5 billion of U.S. Dollar Global Notes are scheduled to mature, of which
$650 million matured in December 2014. For more information on our borrowings, see Note 12 to the
Consolidated Financial Statements in Item 8, which is incorporated herein by reference.
Our debt-to-equity ratio is calculated as the carrying amount of debt divided by total stockholders’
equity. Our debt-to-equity ratio decreased by 0.10x in fiscal 2014, due to a decrease in total debt
balances of $3.1 billion partially offset by a decrease in stockholders’ equity by $0.5 billion at the end of
fiscal 2014. Our debt-to-equity ratio decreased by 0.43x in fiscal 2013, due to a decrease in total debt
balances of $5.8 billion coupled with an increase in stockholders’ equity by $4.8 billion at the end of
fiscal 2013.
For more information on our borrowings, see Note 12 to the Consolidated Financial Statements in
Item 8, which is incorporated herein by reference.
Our weighted-average interest rate reflects the effective interest rate on our borrowings prevailing
during the period and reflects the effect of interest rate swaps. For more information on our interest
rate swaps, see Note 11 to the Consolidated Financial Statements in Item 8, which is incorporated
herein by reference.
74