HP 2014 Annual Report Download - page 66
Download and view the complete annual report
Please find page 66 of the 2014 HP annual report below. You can navigate through the pages in the report by either clicking on the pages listed below, or by using the keyword search tool below to find specific information within the annual report.-
 1
1 -
2
-
3
-
4
-
5
-
6
-
7
-
8
-
9
-
10
-
11
-
12
-
13
-
14
-
15
-
16
-
17
-
18
-
19
-
20
-
21
-
22
-
23
-
24
-
25
-
26
-
27
-
28
-
29
-
30
-
31
-
32
-
33
-
34
-
35
-
36
-
37
-
38
-
39
-
40
-
41
-
42
-
43
-
44
-
45
-
46
-
47
-
48
-
49
-
50
-
51
-
52
-
53
-
54
-
55
-
 56
56 -
 57
57 -
 58
58 -
 59
59 -
 60
60 -
 61
61 -
 62
62 -
 63
63 -
 64
64 -
 65
65 -
 66
66 -
 67
67 -
 68
68 -
 69
69 -
 70
70 -
 71
71 -
 72
72 -
 73
73 -
 74
74 -
 75
75 -
 76
76 -
77
-
78
-
79
-
80
-
81
-
82
-
83
-
84
-
85
-
86
-
87
-
88
-
89
-
90
-
91
-
92
-
93
-
94
-
95
-
96
-
97
-
98
-
99
-
100
-
101
-
102
-
103
-
104
-
105
-
106
-
107
-
108
-
109
-
110
-
111
-
112
-
113
-
114
-
115
-
116
-
117
-
118
-
119
-
120
-
121
-
122
-
123
-
124
-
125
-
126
-
127
-
128
-
129
-
130
-
131
-
132
-
133
-
134
-
135
-
136
-
137
-
138
-
139
-
140
-
141
-
142
-
143
-
144
-
145
-
146
-
147
-
148
-
149
-
150
-
151
-
152
-
153
-
154
-
155
-
156
-
157
-
158
-
159
-
160
-
161
-
162
-
163
-
164
-
165
-
166
-
167
-
168
-
169
-
170
-
171
-
172
-
173
-
174
-
175
-
176
-
177
-
178
-
179
-
180
-
181
-
182
-
183
-
184
-
185
-
186
-
187
-
188
-
189
-
190
-
191
-
192
-
193
-
194
-
195
-
196
 |
 |
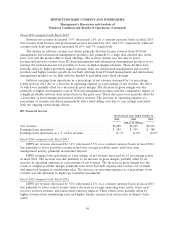
HEWLETT-PACKARD COMPANY AND SUBSIDIARIES
Management’s Discussion and Analysis of
Financial Condition and Results of Operations (Continued)
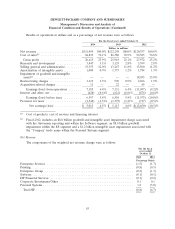
• HPFS gross margin increased slightly due primarily to higher portfolio margins from a lower mix
of operating leases and higher margins on early buyouts; and
• Printing gross margin increased due primarily to improvement in toner gross margins as a result
of lower discounting and higher average revenue per unit (‘‘ARU’’) in consumer printers.
A more detailed discussion of segment gross margins and operating margins is included under
‘‘Segment Information’’ below.
Operating Expenses
Research and Development
R&D expense increased 10% in fiscal 2014 as compared to fiscal 2013 with increases across each
of our segments as we make investments in our strategic focus areas of cloud, security, big data and
mobility.
R&D expense decreased 8% in fiscal 2013 as compared to fiscal 2012 due primarily to the
rationalization of R&D in EG for BCS, cost savings from restructuring and higher value added R&D
tax subsidy credits. The decrease was partially offset by increased R&D expense in our Storage and ISS
business units and in Software for innovation-focused spending in the areas of converged infrastructure
and cloud.
Selling, General and Administrative
SG&A expense increased 1% in fiscal 2014 as compared to fiscal 2013 due primarily to higher
compensation costs, litigation expenses and higher selling costs from investments in the areas of cloud,
networking and storage, partially offset by gains from sales of real estate and lower program spending
in marketing.
SG&A expense decreased 2% in fiscal 2013 as compared to fiscal 2012 due primarily to cost
savings associated with our ongoing restructuring efforts that impacted all of our segments. Partially
offsetting the decline were higher marketing expenses to support new product introductions and
increased administrative expenses due in part to higher consulting project spending.
Amortization of Intangible Assets
Amortization expense decreased in fiscal 2014 due primarily to certain intangible assets associated
with prior acquisitions reaching the end of their respective amortization periods.
Amortization expense decreased in fiscal 2013 due primarily to the intangible asset impairment
recorded in the fourth quarter of fiscal 2012 related to Autonomy and certain intangible assets
associated with prior acquisitions reaching the end of their amortization periods.
Impairment of Goodwill and Intangible Assets
In fiscal 2012, we recorded goodwill impairment charges of $8.0 billion and $5.7 billion associated
with ES and the acquisition of Autonomy, respectively. In addition, we recorded intangible asset
impairment charges of $3.1 billion and $1.2 billion associated with the acquisition of Autonomy and the
‘‘Compaq’’ trade name, respectively. For more information on our impairment charges, see Note 9 to
the Consolidated Financial Statements in Item 8, which is incorporated herein by reference.
58