Clearwire 2010 Annual Report Download - page 99
Download and view the complete annual report
Please find page 99 of the 2010 Clearwire annual report below. You can navigate through the pages in the report by either clicking on the pages listed below, or by using the keyword search tool below to find specific information within the annual report.-
 1
1 -
2
-
3
-
4
-
5
-
6
-
7
-
8
-
9
-
10
-
11
-
12
-
13
-
14
-
15
-
16
-
17
-
18
-
19
-
20
-
21
-
22
-
23
-
24
-
25
-
26
-
27
-
28
-
29
-
30
-
31
-
32
-
33
-
34
-
35
-
36
-
37
-
38
-
39
-
40
-
41
-
42
-
43
-
44
-
45
-
46
-
47
-
48
-
49
-
50
-
51
-
52
-
53
-
54
-
55
-
56
-
57
-
58
-
59
-
60
-
61
-
62
-
63
-
64
-
65
-
66
-
67
-
68
-
69
-
70
-
71
-
72
-
73
-
74
-
75
-
76
-
77
-
78
-
79
-
80
-
81
-
82
-
83
-
84
-
85
-
86
-
87
-
88
-
 89
89 -
 90
90 -
 91
91 -
 92
92 -
 93
93 -
 94
94 -
 95
95 -
 96
96 -
 97
97 -
 98
98 -
 99
99 -
 100
100 -
 101
101 -
 102
102 -
 103
103 -
 104
104 -
 105
105 -
 106
106 -
 107
107 -
 108
108 -
 109
109 -
110
-
111
-
112
-
113
-
114
-
115
-
116
-
117
-
118
-
119
-
120
-
121
-
122
-
123
-
124
-
125
-
126
-
127
-
128
-
129
-
130
-
131
-
132
-
133
-
134
-
135
-
136
-
137
 |
 |

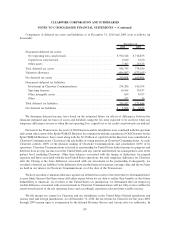
in the pricing models where quoted market prices from securities and derivatives exchanges are available and
reliable. We also use certain unobservable inputs that cannot be validated by reference to a readily observable
market or exchange data and rely, to a certain extent, on management’s own assumptions about the assumptions that
market participants would use in pricing the security. We use many factors that are necessary to estimate market
values, including interest rates, market risks, market spreads, timing of contractual cash flows, market liquidity,
review of underlying collateral and principal, interest and dividend payments.
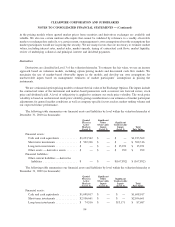
Derivatives
Derivatives are classified in Level 3 of the valuation hierarchy. To estimate the fair value, we use an income
approach based on valuation models, including option pricing models and discounted cash flow models. We
maximize the use of market-based observable inputs in the models and develop our own assumptions for
unobservable inputs based on management estimates of market participants’ assumptions in pricing the
instruments.
We use a trinomial option pricing model to estimate the fair value of the Exchange Options. The inputs include
the contractual terms of the instrument and market-based parameters such as interest rate forward curves, stock
price and dividend yield. A level of subjectivity is applied to estimate our stock price volatility. The stock price
volatility is based on our historical stock price volatility giving consideration to our estimates of market participant
adjustments for general market conditions as well as company-specific factors such as market trading volume and
our expected future performance.
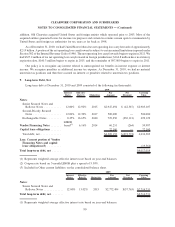
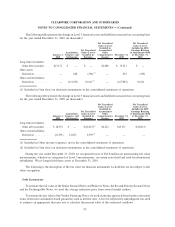
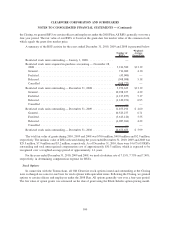
The following table summarizes our financial assets and liabilities by level within the valuation hierarchy at
December 31, 2010 (in thousands):
Quoted
Prices in
Active
Markets
(Level 1)
Significant
Other
Observable
Inputs
(Level 2)
Significant
Unobservable
Inputs
(Level 3)
Total
Fair Value
Financial assets:
Cash and cash equivalents ........... $1,233,562 $ — $ — $1,233,562
Short-term investments .............. $ 502,316 $ — $ — $ 502,316
Long-term investments .............. $ — $ — $ 15,251 $ 15,251
Other assets — derivative assets ....... $ — $ — $ 292 $ 292
Financial liabilities:
Other current liabilities — derivative
liabilities ...................... $ — $ — $(167,892) $ (167,892)
The following table summarizes our financial assets and liabilities by level within the valuation hierarchy at
December 31, 2009 (in thousands):
Quoted
Prices in
Active
Markets
(Level 1)
Significant
Other
Observable
Inputs
(Level 2)
Significant
Unobservable
Inputs
(Level 3)
Total
Fair Value
Financial assets:
Cash and cash equivalents ........... $1,698,017 $ — $ — $1,698,017
Short-term investments .............. $2,106,661 $ — $ — $2,106,661
Long-term investments .............. $ 74,516 $ — $13,171 $ 87,687
94
CLEARWIRE CORPORATION AND SUBSIDIARIES
NOTES TO CONSOLIDATED FINANCIAL STATEMENTS — (Continued)