Clearwire 2010 Annual Report Download - page 107
Download and view the complete annual report
Please find page 107 of the 2010 Clearwire annual report below. You can navigate through the pages in the report by either clicking on the pages listed below, or by using the keyword search tool below to find specific information within the annual report.-
 1
1 -
2
-
3
-
4
-
5
-
6
-
7
-
8
-
9
-
10
-
11
-
12
-
13
-
14
-
15
-
16
-
17
-
18
-
19
-
20
-
21
-
22
-
23
-
24
-
25
-
26
-
27
-
28
-
29
-
30
-
31
-
32
-
33
-
34
-
35
-
36
-
37
-
38
-
39
-
40
-
41
-
42
-
43
-
44
-
45
-
46
-
47
-
48
-
49
-
50
-
51
-
52
-
53
-
54
-
55
-
56
-
57
-
58
-
59
-
60
-
61
-
62
-
63
-
64
-
65
-
66
-
67
-
68
-
69
-
70
-
71
-
72
-
73
-
74
-
75
-
76
-
77
-
78
-
79
-
80
-
81
-
82
-
83
-
84
-
85
-
86
-
87
-
88
-
89
-
90
-
91
-
92
-
93
-
94
-
95
-
96
-
 97
97 -
 98
98 -
 99
99 -
 100
100 -
 101
101 -
 102
102 -
 103
103 -
 104
104 -
 105
105 -
 106
106 -
 107
107 -
 108
108 -
 109
109 -
 110
110 -
 111
111 -
 112
112 -
 113
113 -
 114
114 -
 115
115 -
 116
116 -
 117
117 -
118
-
119
-
120
-
121
-
122
-
123
-
124
-
125
-
126
-
127
-
128
-
129
-
130
-
131
-
132
-
133
-
134
-
135
-
136
-
137
 |
 |

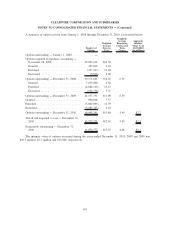
Information regarding stock options outstanding and exercisable as of December 31, 2010 is as follows:
Exercise Prices
Number of
Options
Weighted
Average
Contractual
Life
Remaining
(Years)
Weighted
Average
Exercise
Price
Number of
Options
Weighted
Average
Exercise
Price
Options Outstanding Options Exercisable
$2.25 — $3.00........................ 454,701 1.25 $ 2.86 454,701 $ 2.86
$3.03 ........................... 2,902,000 8.16 3.03 952,000 3.03
$3.53 — $5.45........................ 562,625 6.61 4.34 237,875 4.31
$6.00 ........................... 2,029,238 3.94 6.00 2,029,238 6.00
$6.07 — $7.66........................ 1,940,656 8.64 7.13 410,625 7.24
$7.87 — $15.00 ....................... 2,241,589 5.16 11.78 1,338,283 13.26
$16.02 .......................... 138,625 2.60 16.02 125,875 16.02
$17.11 .......................... 1,768,442 3.55 17.11 1,346,218 17.11
$18.00 — $20.16 ...................... 1,667,621 4.50 18.09 1,663,871 18.08
$23.30 — 25.33 ....................... 2,737,744 5.54 24.25 2,516,086 24.27
Total ......................... 16,443,241 5.69 $11.80 11,074,772 $13.93
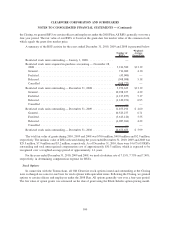
The fair value of each option grant is estimated on the date of grant using the Black-Scholes option pricing
model using the following assumptions for the years ended December 31, 2010, 2009 and 2008:
2010 2009 2008
Year Ended December 31,
Expected volatility .......................... 58.80%-62.22% 63.35%-67.65% 66.52%
Expected dividend yield . . .................... — — —
Expected life (in years) . . .................... 6.25 4.75 - 6.25 4.75
Risk-free interest rate........................ 2.00%-3.15% 1.36% - 2.98% 1.93%
Weighted average fair value per option at grant
date ................................... $4.27 $2.63 $ 2.24
The fair value of option grants in 2010 and 2009 was $4.3 million and $18.6 million, respectively. In addition to
options issued in exchange as part of the Transactions, the fair value of option grants during 2008 was $954,000. The
total fair value of options vested during the years ended December 31, 2010, 2009 and 2008 was $9.8 million,
$5.8 million and $815,000, respectively. The total unrecognized share-based compensation costs related to non-
vested stock options outstanding at December 31, 2010 was approximately $5.8 million and is expected to be
recognized over a weighted average period of approximately 1.3 years.
For the years ended December 31, 2010, 2009 and 2008, we used a forfeiture rate of 10.09%, 12.66% and
12.66% respectively, in determining compensation expense for options.
102
CLEARWIRE CORPORATION AND SUBSIDIARIES
NOTES TO CONSOLIDATED FINANCIAL STATEMENTS — (Continued)