Clearwire 2010 Annual Report Download - page 64
Download and view the complete annual report
Please find page 64 of the 2010 Clearwire annual report below. You can navigate through the pages in the report by either clicking on the pages listed below, or by using the keyword search tool below to find specific information within the annual report.-
 1
1 -
2
-
3
-
4
-
5
-
6
-
7
-
8
-
9
-
10
-
11
-
12
-
13
-
14
-
15
-
16
-
17
-
18
-
19
-
20
-
21
-
22
-
23
-
24
-
25
-
26
-
27
-
28
-
29
-
30
-
31
-
32
-
33
-
34
-
35
-
36
-
37
-
38
-
39
-
40
-
41
-
42
-
43
-
44
-
45
-
46
-
47
-
48
-
49
-
50
-
51
-
52
-
53
-
 54
54 -
 55
55 -
 56
56 -
 57
57 -
 58
58 -
 59
59 -
 60
60 -
 61
61 -
 62
62 -
 63
63 -
 64
64 -
 65
65 -
 66
66 -
 67
67 -
 68
68 -
 69
69 -
 70
70 -
 71
71 -
 72
72 -
 73
73 -
 74
74 -
75
-
76
-
77
-
78
-
79
-
80
-
81
-
82
-
83
-
84
-
85
-
86
-
87
-
88
-
89
-
90
-
91
-
92
-
93
-
94
-
95
-
96
-
97
-
98
-
99
-
100
-
101
-
102
-
103
-
104
-
105
-
106
-
107
-
108
-
109
-
110
-
111
-
112
-
113
-
114
-
115
-
116
-
117
-
118
-
119
-
120
-
121
-
122
-
123
-
124
-
125
-
126
-
127
-
128
-
129
-
130
-
131
-
132
-
133
-
134
-
135
-
136
-
137
 |
 |

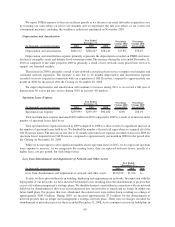
network costs in the prior year. These increases are primarily due to an increase in the number of tower leases and an
increase in related backhaul and network expenses resulting from our network expansion activities and the launch of
44 new 4G markets during 2010.
During the year ended December 31, 2010, we incurred approximately $159.2 million in charges related to
obsolete CPE, write-offs of identified differences between recorded amounts and the results of physical counts of
network base station equipment and an increase in our reserve for excess and obsolete equipment. Shrinkage of
network base station equipment primarily represents losses experienced during the deployment process, while the
reserves for excess and obsolete equipment represents the costs of equipment that exceeds our current needs, or is no
longer being deployed in the networks due to obsolescence. Write-offs of CPE primarily represent leased modems
not expected to be recovered from former subscribers. During 2009, we incurred approximately $53.0 million due
to write-offs of CPE, identified differences between recorded amounts and the results of physical counts of network
base station equipment and an increase in reserves for excess and obsolete equipment.
For the year ended December 31, 2009, we incurred approximately $279.4 million in tower costs and
$33.0 million in network costs, compared to approximately $48.7 million in tower costs and $21.9 million in
network costs in 2008. These increases are primarily due to an increase in the number of tower leases and an
increase in related backhaul and network expenses resulting from the launch of 27 new 4G markets during 2009. We
incurred twelve months of tower costs and related backhaul and network expenses during 2009, compared to one
month for 2008 following the Closing on November 28, 2008, when we acquired all of the Old Clearwire tower
leases and backhaul agreements.
We expect costs of goods and services and network costs, excluding the impact of write-offs and obsolescence
allowance described above, to continue to increase in future periods as we operate our networks in our launched
markets for a full year.
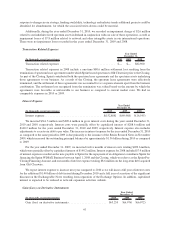
Selling, General and Administrative Expense
Selling, general and administrative, which we refer to as SG&A, expenses include all of the following: costs
associated with salaries and benefits; advertising, trade shows, public relations, promotions and other market
development programs; facilities costs; third-party professional service fees; customer care; sales commissions;
bad debt expense; and administrative support activities, including executive, finance and accounting, IT, legal,
human resources, treasury and other shared services.
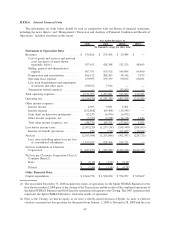
(In thousands, except percentages) 2010 2009 2008
Percentage
Change 2010
Versus 2009
Percentage
Change 2009
Versus 2008
Year Ended
December 31,
Selling, general and administrative
expense .................. $907,793 $553,915 $149,904 63.9% 269.5%
The increase in SG&A expenses for the year ended December 31, 2010 as compared to the same period in 2009
is primarily due to the higher sales and marketing and customer care expenses as well as additional resources,
headcount and shared services that we utilized as we launched our 4G mobile broadband services in additional
markets in 2010. Marketing and advertising costs increased $115.0 million, or 116%, in 2010 from 2009 due to the
increase in gross subscriber additions and costs incurred in support of the launch of 44 new 4G markets during 2010.
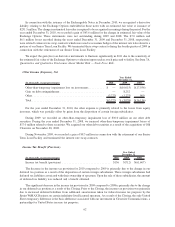
Employee related costs increased $181.4 million, or 55%, in 2010 compared to 2009 primarily due to an increase in
headcount during the year. Prior to the workforce reductions announced in November 2010, we had approximately
4,200 employees. Our average employee headcount increased approximately 46% for the year ended December 31,
2010 when compared to the year ended December 31, 2009.
The increase in SG&A expenses in 2009 compared to 2008 is consistent with the additional resources,
headcount and shared services that we utilized as we continued to build and launch our 4G mobile broadband
services in additional markets, especially the higher sales and marketing and customer care expenses in support of
the launch of new markets. Employee headcount increased at December 31, 2009 to approximately 3,440 employees
compared to approximately 1,635 employees at December 31, 2008.
59