Clearwire 2010 Annual Report Download - page 88
Download and view the complete annual report
Please find page 88 of the 2010 Clearwire annual report below. You can navigate through the pages in the report by either clicking on the pages listed below, or by using the keyword search tool below to find specific information within the annual report.-
 1
1 -
2
-
3
-
4
-
5
-
6
-
7
-
8
-
9
-
10
-
11
-
12
-
13
-
14
-
15
-
16
-
17
-
18
-
19
-
20
-
21
-
22
-
23
-
24
-
25
-
26
-
27
-
28
-
29
-
30
-
31
-
32
-
33
-
34
-
35
-
36
-
37
-
38
-
39
-
40
-
41
-
42
-
43
-
44
-
45
-
46
-
47
-
48
-
49
-
50
-
51
-
52
-
53
-
54
-
55
-
56
-
57
-
58
-
59
-
60
-
61
-
62
-
63
-
64
-
65
-
66
-
67
-
68
-
69
-
70
-
71
-
72
-
73
-
74
-
75
-
76
-
77
-
 78
78 -
 79
79 -
 80
80 -
 81
81 -
 82
82 -
 83
83 -
 84
84 -
 85
85 -
 86
86 -
 87
87 -
 88
88 -
 89
89 -
 90
90 -
 91
91 -
 92
92 -
 93
93 -
 94
94 -
 95
95 -
 96
96 -
 97
97 -
 98
98 -
99
-
100
-
101
-
102
-
103
-
104
-
105
-
106
-
107
-
108
-
109
-
110
-
111
-
112
-
113
-
114
-
115
-
116
-
117
-
118
-
119
-
120
-
121
-
122
-
123
-
124
-
125
-
126
-
127
-
128
-
129
-
130
-
131
-
132
-
133
-
134
-
135
-
136
-
137
 |
 |

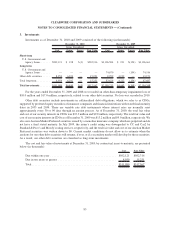
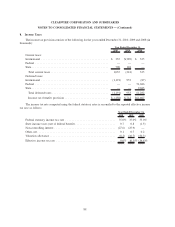
3. Investments
Investments as of December 31, 2010 and 2009 consisted of the following (in thousands):
Cost Gains Losses Fair Value Cost Gains Losses Fair Value
Gross Unrealized Gross Unrealized
December 31, 2010 December 31, 2009
Short-term
U.S. Government and
Agency Issues ...... $502,121 $ 198 $ (3) $502,316 $2,106,584 $ 231 $(154) $2,106,661
Long-term
U.S. Government and
Agency Issues ...... — — — — 74,670 — (154) 74,516
Other debt securities ..... 8,959 6,292 — 15,251 8,959 4,212 — 13,171
Total long-term . ........ 8,959 6,292 — 15,251 83,629 4,212 (154) 87,687
Total investments ....... $511,080 $6,490 $ (3) $517,567 $2,190,213 $4,443 $(308) $2,194,348
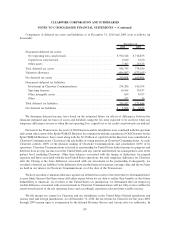
For the years ended December 31, 2009 and 2008 we recorded an other-than-temporary impairment loss of
$10.0 million and $17.0 million, respectively, related to our other debt securities. No loss was recorded in 2010.
Other debt securities include investments in collateralized debt obligations, which we refer to as CDOs,
supported by preferred equity securities of insurance companies and financial institutions with stated final maturity
dates in 2033 and 2034. These are variable rate debt instruments whose interest rates are normally reset
approximately every 30 or 90 days through an auction process. As of December 31, 2010, the total fair value
and cost of our security interests in CDOs was $15.3 million and $9.0 million, respectively. The total fair value and
cost of our security interests in CDOs as of December 31, 2009 was $13.2 million and $9.0 million, respectively. We
also own Auction Market Preferred securities issued by a monoline insurance company which are perpetual and do
not have a final stated maturity. In July 2009, the issuer’s credit rating was downgraded to CC and Caa2 by
Standard & Poor’s and Moody’s rating services, respectively, and the total fair value and cost of our Auction Market
Preferred securities was written down to $0. Current market conditions do not allow us to estimate when the
auctions for our other debt securities will resume, if ever, or if a secondary market will develop for these securities.
As a result, our other debt securities are classified as long-term investments.
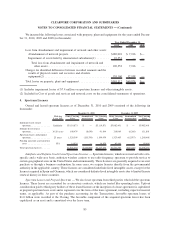
The cost and fair value of investments at December 31, 2010, by contractual years-to-maturity, are presented
below (in thousands):
Cost Fair Value
Due within one year .......................................... $502,121 $502,316
Due in ten years or greater ..................................... 8,959 15,251
Total ...................................................... $511,080 $517,567
83
CLEARWIRE CORPORATION AND SUBSIDIARIES
NOTES TO CONSOLIDATED FINANCIAL STATEMENTS — (Continued)