Clearwire 2010 Annual Report Download - page 70
Download and view the complete annual report
Please find page 70 of the 2010 Clearwire annual report below. You can navigate through the pages in the report by either clicking on the pages listed below, or by using the keyword search tool below to find specific information within the annual report.-
 1
1 -
2
-
3
-
4
-
5
-
6
-
7
-
8
-
9
-
10
-
11
-
12
-
13
-
14
-
15
-
16
-
17
-
18
-
19
-
20
-
21
-
22
-
23
-
24
-
25
-
26
-
27
-
28
-
29
-
30
-
31
-
32
-
33
-
34
-
35
-
36
-
37
-
38
-
39
-
40
-
41
-
42
-
43
-
44
-
45
-
46
-
47
-
48
-
49
-
50
-
51
-
52
-
53
-
54
-
55
-
56
-
57
-
58
-
59
-
 60
60 -
 61
61 -
 62
62 -
 63
63 -
 64
64 -
 65
65 -
 66
66 -
 67
67 -
 68
68 -
 69
69 -
 70
70 -
 71
71 -
 72
72 -
 73
73 -
 74
74 -
 75
75 -
 76
76 -
 77
77 -
 78
78 -
 79
79 -
 80
80 -
81
-
82
-
83
-
84
-
85
-
86
-
87
-
88
-
89
-
90
-
91
-
92
-
93
-
94
-
95
-
96
-
97
-
98
-
99
-
100
-
101
-
102
-
103
-
104
-
105
-
106
-
107
-
108
-
109
-
110
-
111
-
112
-
113
-
114
-
115
-
116
-
117
-
118
-
119
-
120
-
121
-
122
-
123
-
124
-
125
-
126
-
127
-
128
-
129
-
130
-
131
-
132
-
133
-
134
-
135
-
136
-
137
 |
 |

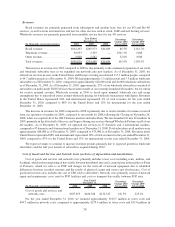
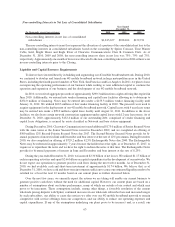
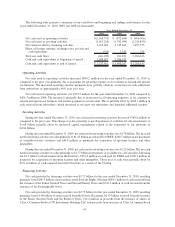
The following table presents a summary of our cash flows and beginning and ending cash balances for the
years ended December 31, 2010, 2009 and 2008 (in thousands):
2010 2009 2008
Year Ended December 31,
Net cash used in operating activities ............... $(1,168,713) $ (472,484) $ (406,306)
Net cash used in investing activities ............... (1,013,218) (1,782,999) (2,245,830)
Net cash provided by financing activities ........... 1,718,001 2,745,847 3,857,755
Effect of foreign currency exchange rates on cash and
cash equivalents ............................ (525) 1,510 524
Total net cash flows ........................... (464,455) 491,874 1,206,143
Cash and cash equivalents at beginning of period ..... 1,698,017 1,206,143 —
Cash and cash equivalents at end of period .......... $1,233,562 $ 1,698,017 $ 1,206,143
Operating Activities
Net cash used in operating activities increased $696.2 million for the year ended December 31, 2010 as
compared to the prior year primarily due to payments for operating expense as we continue to expand and operate
our business. The increased operating expense payments were partially offset by an increase in cash collections
from subscribers of approximately 96% year over year.
Net cash used in operating activities was $472.5 million for the year ended December 31, 2009 compared to
$406.3 million in 2008. The increase is primarily due to an increase in all operating expenses, as we continue to
expand and operate our business, and interest payments to service debt. This is partially offset by $268.1 million in
cash received from subscribers, which increased as we grew our subscribers and launched additional markets.
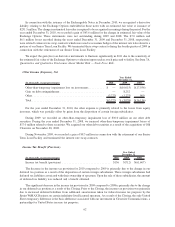
Investing Activities
During the year ended December 31, 2010, net cash used in investing activities decreased $769.8 million as
compared to the prior year. This change was due primarily to net dispositions of available-for-sale investments of
$1.68 billion partially offset by increased capital expenditures related to the expansion of our networks of
$2.66 billion.
During the year ended December 31, 2009, net cash used in investing activities was $1.78 billion. The net cash
used in investing activities was due primarily to $1.45 billion in cash paid for PP&E, $290.7 million in net purchases
of available-for-sale securities and $46.8 million in payments for acquisition of spectrum licenses and other
intangibles.
During the year ended December 31, 2008, net cash used in investing activities was $2.25 billion. The net cash
used in investing activities was due primarily to $1.77 billion in purchases of available-for-sale securities following
the $3.2 billion cash investment from the Investors, $534.2 million in cash paid for PP&E and $109.3 million in
payments for acquisition of spectrum licenses and other intangibles. These uses of cash were partially offset by
$171.8 million of cash acquired from Old Clearwire as a result of the Closing.
Financing Activities
Net cash provided by financing activities was $1.72 billion for the year ended December 31, 2010, resulting
primarily from $290.3 million of proceeds received from the Rights Offering, $684.1 million of cash received from
the issuance of the Senior Secured Notes and Second Priority Notes and $729.2 million of cash received from the
issuance of the Exchangeable Notes.
Net cash provided by financing activities was $2.75 billion for the year ended December 31, 2009, resulting
primarily from $1.48 billion of cash received from the Private Placement, $2.47 billion received from the issuance
of the Senior Secured Notes and the Rollover Notes, $12.2 million in proceeds from the issuance of shares of
Class A Common Stock to CW Investments Holdings LLC and proceeds from exercises of Class A Common Stock
65