Clearwire 2010 Annual Report Download - page 59
Download and view the complete annual report
Please find page 59 of the 2010 Clearwire annual report below. You can navigate through the pages in the report by either clicking on the pages listed below, or by using the keyword search tool below to find specific information within the annual report.-
 1
1 -
2
-
3
-
4
-
5
-
6
-
7
-
8
-
9
-
10
-
11
-
12
-
13
-
14
-
15
-
16
-
17
-
18
-
19
-
20
-
21
-
22
-
23
-
24
-
25
-
26
-
27
-
28
-
29
-
30
-
31
-
32
-
33
-
34
-
35
-
36
-
37
-
38
-
39
-
40
-
41
-
42
-
43
-
44
-
45
-
46
-
47
-
48
-
 49
49 -
 50
50 -
 51
51 -
 52
52 -
 53
53 -
 54
54 -
 55
55 -
 56
56 -
 57
57 -
 58
58 -
 59
59 -
 60
60 -
 61
61 -
 62
62 -
 63
63 -
 64
64 -
 65
65 -
 66
66 -
 67
67 -
 68
68 -
 69
69 -
70
-
71
-
72
-
73
-
74
-
75
-
76
-
77
-
78
-
79
-
80
-
81
-
82
-
83
-
84
-
85
-
86
-
87
-
88
-
89
-
90
-
91
-
92
-
93
-
94
-
95
-
96
-
97
-
98
-
99
-
100
-
101
-
102
-
103
-
104
-
105
-
106
-
107
-
108
-
109
-
110
-
111
-
112
-
113
-
114
-
115
-
116
-
117
-
118
-
119
-
120
-
121
-
122
-
123
-
124
-
125
-
126
-
127
-
128
-
129
-
130
-
131
-
132
-
133
-
134
-
135
-
136
-
137
 |
 |
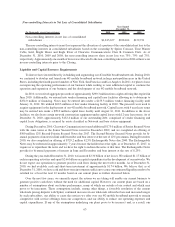
• significant negative industry or economic trends.
The impairment test for intangible assets with indefinite useful lives consists of a comparison of the fair value of
the intangible asset with its carrying amount. We calculate the fair value of spectrum using a discounted cash flow
model (the Greenfield Approach), which approximates value by assuming a company is started owning only the
spectrum licenses, and then makes investments required to build an operation comparable to the one in which the
licenses are presently utilized. We utilized a 10 year discrete period to isolate cash flows attributable to the licenses
including modeling the hypothetical build out of a nationwide network. Assumptions key in estimating fair value
under this method include, but are not limited to, revenue and subscriber growth rates, operating expenditures, capital
expenditures and timing of build out, market share achieved, terminal value growth rate, tax rates and discount rate.
The assumptions which underlie the development of the network, subscriber base and other critical inputs of the
discounted cash flow model were based on a combination of average marketplace participant data and our historical
results and business plans. The discount rate used in the model represents a weighted average cost of capital taking into
account the cost of debt and equity financing weighted by the percentage of debt and equity in a target capital structure
and the perceived risk associated with an intangible asset such as our spectrum licenses. The terminal value growth
rate represents our estimate of the marketplace’s long term growth rate. We validate the fair value obtained from the
Greenfield Approach against market data, when available. We had no impairment of our indefinite lived intangible
assets in the United States in any of the periods presented. If the projected buildout to the target population coverage
was delayed by one year and the buildout rate of preceding periods were to decline by 5%, the fair values of the
licenses, while less than currently projected, would still be higher than their book values. However, if there is a
substantial adverse decline in the operating profitability of the wireless service industry, we could have material
impairment charges in future years which could adversely affect our results of operations and financial condition.
Impairments of Long-lived Assets
We review our long-lived assets to be held and used, including property, plant and equipment, which we refer
to as PP&E, and intangible assets with definite useful lives, which consists primarily of spectrum licenses with
definite lives and subscriber relationships, for recoverability whenever an event or change in circumstances
indicates that the carrying amount of such long-lived asset or group of long-lived assets may not be recoverable.
Such circumstances include, but are not limited to the following:
• a significant decrease in the market price of the asset;
• a significant change in the extent or manner in which the asset is being used;
• a significant change in the business climate that could affect the value of the asset;
• a current period loss combined with projections of continuing losses associated with use of the asset;
• a significant change in our business or technology strategy;
• a significant change in our management’s views of growth rates for our business; and
• a significant change in the anticipated future economic and regulatory conditions and expected techno-
logical availability.
We evaluate quarterly, or as needed, whether such events and circumstances have occurred. A significant
amount of judgment is involved in determining the occurrence of an indicator of impairment that requires an
evaluation of the recoverability of our long-lived assets. When such events or circumstances exist, we determine the
recoverability of the asset’s carrying value by estimating the undiscounted future net cash flows (cash inflows less
associated cash outflows) that are directly associated with and that are expected to arise as a direct result of the use
of the asset. Recoverability analyses, when performed, are based on probability-weighted forecasted cash flows that
consider our business and technology strategy, management’s views of growth rates for the business, anticipated
future economic and regulatory conditions and expected technological availability. If the total of the expected
undiscounted future net cash flows is less than the carrying amount of the asset, an impairment, if any, is recognized
for the difference between the fair value of the asset and its carrying value.
54
CLEARWIRE CORPORATION AND SUBSIDIARIES — (Continued)