Clearwire 2010 Annual Report Download - page 65
Download and view the complete annual report
Please find page 65 of the 2010 Clearwire annual report below. You can navigate through the pages in the report by either clicking on the pages listed below, or by using the keyword search tool below to find specific information within the annual report.-
 1
1 -
2
-
3
-
4
-
5
-
6
-
7
-
8
-
9
-
10
-
11
-
12
-
13
-
14
-
15
-
16
-
17
-
18
-
19
-
20
-
21
-
22
-
23
-
24
-
25
-
26
-
27
-
28
-
29
-
30
-
31
-
32
-
33
-
34
-
35
-
36
-
37
-
38
-
39
-
40
-
41
-
42
-
43
-
44
-
45
-
46
-
47
-
48
-
49
-
50
-
51
-
52
-
53
-
54
-
 55
55 -
 56
56 -
 57
57 -
 58
58 -
 59
59 -
 60
60 -
 61
61 -
 62
62 -
 63
63 -
 64
64 -
 65
65 -
 66
66 -
 67
67 -
 68
68 -
 69
69 -
 70
70 -
 71
71 -
 72
72 -
 73
73 -
 74
74 -
 75
75 -
76
-
77
-
78
-
79
-
80
-
81
-
82
-
83
-
84
-
85
-
86
-
87
-
88
-
89
-
90
-
91
-
92
-
93
-
94
-
95
-
96
-
97
-
98
-
99
-
100
-
101
-
102
-
103
-
104
-
105
-
106
-
107
-
108
-
109
-
110
-
111
-
112
-
113
-
114
-
115
-
116
-
117
-
118
-
119
-
120
-
121
-
122
-
123
-
124
-
125
-
126
-
127
-
128
-
129
-
130
-
131
-
132
-
133
-
134
-
135
-
136
-
137
 |
 |

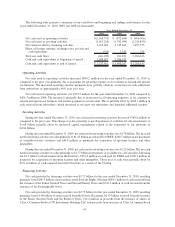
We expect SG&A expense to decrease in future periods as we decrease our retail subscriber acquisition costs
by focusing our sales efforts on lower cost channels and we experience the full year effects of our recent cost
containment measures, including the workforce reductions announced in November 2010.
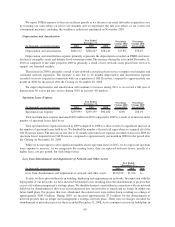
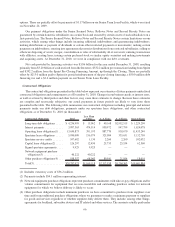
Depreciation and Amortization
(In thousands, except percentages) 2010 2009 2008
Percentage
Change 2010
Versus 2009
Percentage
Change 2009
Versus 2008
Year Ended
December 31,
Depreciation and amortization ..... $466,112 $208,263 $58,146 123.8% 258.2%
Depreciation and amortization expense primarily represents the depreciation recorded on PP&E and amor-
tization of intangible assets and definite-lived owned spectrum. The increase during the year ended December 31,
2010 as compared to the same period in 2009 is primarily a result of new network assets placed into service to
support our launched markets.
The increase in 2009 is primarily a result of new network assets placed into service to support our launches and
continued network expansion. The increase is also due to 12 months depreciation and amortization expense
recorded on assets acquired in connection with our acquisition of Old Clearwire, compared to approximately one
month in 2008 for the period after the Closing on November 28, 2008.
We expect depreciation and amortization will continue to increase during 2011 as we record a full year of
depreciation for assets put into service during 2010 in our new 4G markets.
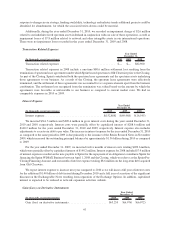
Spectrum Lease Expense
(In thousands, except percentages) 2010 2009 2008
Percentage
Change 2010
Versus 2009
Percentage
Change 2009
Versus 2008
Year Ended
December 31,
Spectrum lease expense ......... $279,993 $259,359 $90,032 8.0% 188.1%
Total spectrum lease expense increased $20.6 million in 2010 compared to 2009 as a result of an increase in the
number of spectrum leases held by us.
Total spectrum lease expense increased in 2009 compared to 2008 as a direct result of a significant increase in
the number of spectrum leases held by us. We doubled the number of leased call signs when we acquired all of the
Old Clearwire leases. The increase is also due to 12 months spectrum lease expense recorded on leases in 2009 for
spectrum leases acquired from Old Clearwire, compared to approximately one month in 2008 for the period after
the Closing on November 28, 2008.
While we do not expect to add a significant number of new spectrum leases in 2011, we do expect our spectrum
lease expense to increase. As we renegotiate the existing leases, they are replaced with new leases, usually at a
higher lease cost per month, but with longer terms.
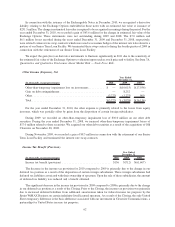
Loss from Abandonment and Impairment of Network and Other Assets
(In thousands, except percentages) 2010 2009 2008
Year Ended
December 31,
Loss from abandonment and impairment of network and other assets . . $190,352 $7,916 $—
To date, we have invested heavily in building, deploying and augmenting our networks. In connection with the
deployment of our networks, we have incurred substantial losses resulting from the abandonment of projects that
cease to fit within management’s strategic plans. We identified projects undertaken in connection with our network
build-out for abandonment if they were not incorporated into our networks at launch and no longer fit within our
future build plans. For projects that were abandoned, the related costs were written down, resulting in a charge of
approximately $180.0 million. During 2009, we incurred approximately $7.9 million for the abandonment of
network projects that no longer met management’s strategic network plans. There were no charges recorded for
abandonment of network projects for the year ended December 31, 2008. As we continue to revise our build plans in
60