Clearwire 2010 Annual Report Download - page 55
Download and view the complete annual report
Please find page 55 of the 2010 Clearwire annual report below. You can navigate through the pages in the report by either clicking on the pages listed below, or by using the keyword search tool below to find specific information within the annual report.-
 1
1 -
2
-
3
-
4
-
5
-
6
-
7
-
8
-
9
-
10
-
11
-
12
-
13
-
14
-
15
-
16
-
17
-
18
-
19
-
20
-
21
-
22
-
23
-
24
-
25
-
26
-
27
-
28
-
29
-
30
-
31
-
32
-
33
-
34
-
35
-
36
-
37
-
38
-
39
-
40
-
41
-
42
-
43
-
44
-
 45
45 -
 46
46 -
 47
47 -
 48
48 -
 49
49 -
 50
50 -
 51
51 -
 52
52 -
 53
53 -
 54
54 -
 55
55 -
 56
56 -
 57
57 -
 58
58 -
 59
59 -
 60
60 -
 61
61 -
 62
62 -
 63
63 -
 64
64 -
 65
65 -
66
-
67
-
68
-
69
-
70
-
71
-
72
-
73
-
74
-
75
-
76
-
77
-
78
-
79
-
80
-
81
-
82
-
83
-
84
-
85
-
86
-
87
-
88
-
89
-
90
-
91
-
92
-
93
-
94
-
95
-
96
-
97
-
98
-
99
-
100
-
101
-
102
-
103
-
104
-
105
-
106
-
107
-
108
-
109
-
110
-
111
-
112
-
113
-
114
-
115
-
116
-
117
-
118
-
119
-
120
-
121
-
122
-
123
-
124
-
125
-
126
-
127
-
128
-
129
-
130
-
131
-
132
-
133
-
134
-
135
-
136
-
137
 |
 |

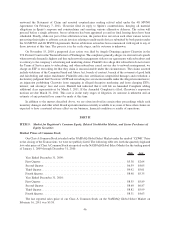
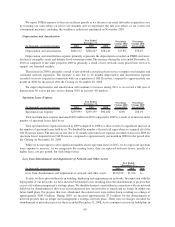
ended December 31, 2007. We have calculated and presented basic and diluted net loss per share for the period
from November 29, 2008 through December 31, 2008 and for the years ended December 31, 2009 and 2010.
2010 2009 2008 2007
As of December 31,
(In thousands)
Operating Data:
Subscribers:
United States:
Retail(1) ............................................ 1,099 595 424 —
Wholesale(2) ......................................... 3,246 46 — —
International — Retail .................................... 40 47 51 —
(1) Represents the number of household individuals and business or governmental entities receiving wireless
broadband connectivity through our networks.
(2) Represents the number of devices on our networks.
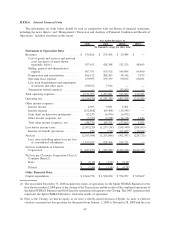
2010 2009 2008 2007
As of December 31,
(In thousands)
Balance Sheet Data:
Cash and cash equivalents............ $ 1,233,562 $ 1,698,017 $1,206,143 $ —
Investments (short- and long-term) ..... 517,567 2,194,348 1,920,723 —
Property, plant and equipment, net ..... 4,464,534 2,596,520 1,319,945 491,896
Spectrum licenses, net .............. 4,417,492 4,495,134 4,471,862 2,642,590
Total assets ...................... 11,040,486 11,267,853 9,124,167 3,144,158
Long-term debt, net ................ 4,017,019 2,714,731 1,350,498 —
Non-controlling interests ............. 4,546,788 6,181,525 5,436,618 —
Total stockholders’ equity ............ 5,869,998 7,772,368 7,502,810 2,464,936
50