Clearwire 2010 Annual Report Download - page 54
Download and view the complete annual report
Please find page 54 of the 2010 Clearwire annual report below. You can navigate through the pages in the report by either clicking on the pages listed below, or by using the keyword search tool below to find specific information within the annual report.-
 1
1 -
2
-
3
-
4
-
5
-
6
-
7
-
8
-
9
-
10
-
11
-
12
-
13
-
14
-
15
-
16
-
17
-
18
-
19
-
20
-
21
-
22
-
23
-
24
-
25
-
26
-
27
-
28
-
29
-
30
-
31
-
32
-
33
-
34
-
35
-
36
-
37
-
38
-
39
-
40
-
41
-
42
-
43
-
 44
44 -
 45
45 -
 46
46 -
 47
47 -
 48
48 -
 49
49 -
 50
50 -
 51
51 -
 52
52 -
 53
53 -
 54
54 -
 55
55 -
 56
56 -
 57
57 -
 58
58 -
 59
59 -
 60
60 -
 61
61 -
 62
62 -
 63
63 -
 64
64 -
65
-
66
-
67
-
68
-
69
-
70
-
71
-
72
-
73
-
74
-
75
-
76
-
77
-
78
-
79
-
80
-
81
-
82
-
83
-
84
-
85
-
86
-
87
-
88
-
89
-
90
-
91
-
92
-
93
-
94
-
95
-
96
-
97
-
98
-
99
-
100
-
101
-
102
-
103
-
104
-
105
-
106
-
107
-
108
-
109
-
110
-
111
-
112
-
113
-
114
-
115
-
116
-
117
-
118
-
119
-
120
-
121
-
122
-
123
-
124
-
125
-
126
-
127
-
128
-
129
-
130
-
131
-
132
-
133
-
134
-
135
-
136
-
137
 |
 |

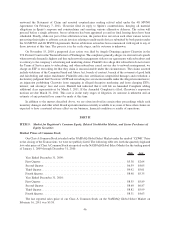
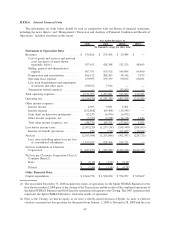
ITEM 6. Selected Financial Data
The information set forth below should be read in conjunction with our historical financial statements,
including the notes thereto, and “Management’s Discussion and Analysis of Financial Condition and Results of
Operations,” included elsewhere in this report.
2010 2009 2008(1) 2007(1)
Year Ended December 31,
(In thousands, except per share data)
Statements of Operations Data:
Revenues .......................... $ 556,826 $ 274,458 $ 20,489 $ —
Cost of goods and services and network
costs (exclusive of items shown
separately below)................. 927,455 428,348 132,525 48,865
Selling, general and administrative
expense ........................ 907,793 553,915 149,904 99,490
Depreciation and amortization ......... 466,112 208,263 58,146 3,979
Spectrum lease expense . ............. 279,993 259,359 90,032 60,051
Loss from abandonment and impairment
of network and other assets ......... 190,352 7,916 — —
Transaction related expenses .......... — — 82,960 —
Total operating expenses . . ............. 2,771,705 1,457,801 513,567 212,385
Operating loss ...................... (2,214,879) (1,183,343) (493,078) (212,385)
Other income (expense):
Interest income .................... 4,965 9,691 1,091 —
Interest expense ................... (152,868) (69,468) (16,545) —
Gain (loss) on derivative instruments .... 63,255 (6,976) (6,072) —
Other income (expense), net .......... (3,723) (3,038) (16,136) 4,022
Total other income (expense), net ...... (88,371) (69,791) (37,662) 4,022
Loss before income taxes . ............. (2,303,250) (1,253,134) (530,740) (208,363)
Income tax benefit (provision) ......... 156 (712) (61,607) (16,362)
Net loss ........................... (2,303,094) (1,253,846) (592,347) (224,725)
Less: non-controlling interests in net loss
of consolidated subsidiaries ......... 1,815,657 928,264 159,721 —
Net loss attributable to Clearwire
Corporation....................... $ (487,437) $ (325,582) $(432,626) $(224,725)
Net loss per Clearwire Corporation Class A
Common Share(2):
Basic ........................... $ (2.19) $ (1.72) $ (0.16)
Diluted .......................... $ (2.46) $ (1.74) $ (0.28)
Other Financial Data:
Capital expenditures .................. $2,664,750 $ 1,540,030 $ 574,957 $ 329,469
(1) The year ended December 31, 2008 includes the results of operations for the Sprint WiMAX Business for the
first eleven months of 2008 prior to the closing of the Transactions and the results of the combined operations of
the Sprint WiMAX Business and Old Clearwire operations subsequent to the Closing. The 2007 operations data
represents the Sprint WiMAX Business’ historical results of operations.
(2) Prior to the Closing, we had no equity as we were a wholly-owned division of Sprint. As such, we did not
calculate or present net loss per share for the period from January 1, 2008 to November 28, 2008 and the year
49