Clearwire 2010 Annual Report Download - page 63
Download and view the complete annual report
Please find page 63 of the 2010 Clearwire annual report below. You can navigate through the pages in the report by either clicking on the pages listed below, or by using the keyword search tool below to find specific information within the annual report.-
 1
1 -
2
-
3
-
4
-
5
-
6
-
7
-
8
-
9
-
10
-
11
-
12
-
13
-
14
-
15
-
16
-
17
-
18
-
19
-
20
-
21
-
22
-
23
-
24
-
25
-
26
-
27
-
28
-
29
-
30
-
31
-
32
-
33
-
34
-
35
-
36
-
37
-
38
-
39
-
40
-
41
-
42
-
43
-
44
-
45
-
46
-
47
-
48
-
49
-
50
-
51
-
52
-
 53
53 -
 54
54 -
 55
55 -
 56
56 -
 57
57 -
 58
58 -
 59
59 -
 60
60 -
 61
61 -
 62
62 -
 63
63 -
 64
64 -
 65
65 -
 66
66 -
 67
67 -
 68
68 -
 69
69 -
 70
70 -
 71
71 -
 72
72 -
 73
73 -
74
-
75
-
76
-
77
-
78
-
79
-
80
-
81
-
82
-
83
-
84
-
85
-
86
-
87
-
88
-
89
-
90
-
91
-
92
-
93
-
94
-
95
-
96
-
97
-
98
-
99
-
100
-
101
-
102
-
103
-
104
-
105
-
106
-
107
-
108
-
109
-
110
-
111
-
112
-
113
-
114
-
115
-
116
-
117
-
118
-
119
-
120
-
121
-
122
-
123
-
124
-
125
-
126
-
127
-
128
-
129
-
130
-
131
-
132
-
133
-
134
-
135
-
136
-
137
 |
 |

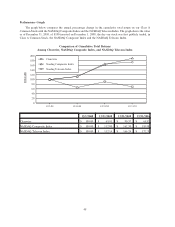
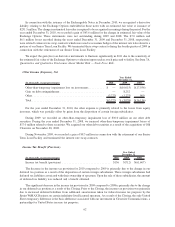
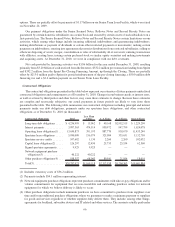
Revenues
Retail revenues are primarily generated from subscription and modem lease fees for our 4G and Pre-4G
services, as well as from activation fees and fees for other services such as email, VoIP, and web hosting services.
Wholesale revenues are primarily generated from monthly service fees for our 4G services.
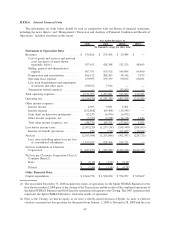
(In thousands, except percentages) 2010 2009 2008
Percentage
Change 2010
Versus 2009
Percentage
Change 2009
Versus 2008
Year Ended
December 31,
Retail revenue ................ $502,293 $269,373 $20,489 86.5% 1214.7%
Wholesale revenue . . ........... 50,593 2,503 — 1921.3% N/M
Other revenue................. 3,940 2,582 — 52.6% N/M
Total revenues ................ $556,826 $274,458 $20,489 102.9% 1239.5%
The increase in revenues for 2010 compared to 2009 is due primarily to the continued expansion of our retail
and wholesale subscriber base as we expanded our networks into new markets. As of December 31, 2010, we
offered our services in areas in the United States and Europe covering an estimated 117.1 million people, compared
to 44.7 million people as of December 31, 2009. We had approximately 1.1 million retail and 3.3 million wholesale
subscribers as of December 31, 2010, compared to approximately 642,000 retail and 46,000 wholesale subscribers
as of December 31, 2009. As of December 31, 2010, approximately 27% of our wholesale subscribers consisted of
subscribers on multi-mode 3G/4G devices that resided outside of our currently launched 4G markets, but for whom
we receive nominal revenue. Wholesale revenue in 2010 is based upon minimal wholesale rate and usage
assumptions due to unresolved issues around wholesale pricing for wholesale transactions with Sprint. Revenues
in the United States represented 96% and international represented 4% of total revenues for the year ended
December 31, 2010, compared to 88% for the United States and 12% for international for the year ended
December 31, 2009.
The increase in revenues for 2009 compared to 2008 is primarily due to twelve months of revenues received
from our operation of markets in 2009, compared to one month for 2008 following the Closing on November 28,
2008, when we acquired all of the Old Clearwire markets and subscribers. We also launched 10 new 4G markets in
2009, primarily in the latter half of the year, and began offering our services through Wholesale Partners in all of our
4G markets. As of December 31, 2009, we operated our services in 57 domestic and 4 international markets,
compared to 47 domestic and 4 international markets as of December 31, 2008. Total subscribers in all markets were
approximately 688,000 as of December 31, 2009, compared to 475,000 as of December 31, 2008. Revenues in the
United States represented 88% and international represented 12% of total revenues for the year ended December 31,
2009, compared to 87% for the United States and 13% for international for the year ended December 31, 2008.
We expect revenues to continue to increase in future periods primarily due to expected growth in wholesale
subscribers and the full year benefit of subscribers acquired during 2010.
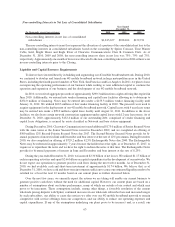
Cost of Goods and Services and Network Costs (exclusive of depreciation and amortization)
Cost of goods and services and network costs primarily includes tower costs including rents, utilities, and
backhaul, which is the transporting of data traffic between distributed sites and a central point in the market or Point
of Presence, which we refer to as POP, and charges for the write-off of network equipment due to identified
differences between recorded amounts and the results of physical counts and excess and obsolescence. Cost of
goods and services also includes the cost of CPE sold to subscribers. Network costs primarily consist of network
repair and maintenance costs, rent for POP facilities and costs to transport data traffic between POP sites.
(In thousands, except percentages) 2010 2009 2008
Percentage
Change 2010
Versus 2009
Percentage
Change 2009
Versus 2008
Year Ended
December 31,
Cost of goods and services and
network costs .............. $927,455 $428,348 $132,525 116.5% 223.2%
For the year ended December 31, 2010, we incurred approximately $519.7 million in tower costs and
$94.7 million in network costs, compared to approximately $279.4 million in tower costs and $33.0 million in
58