Cablevision 2013 Annual Report Download - page 79
Download and view the complete annual report
Please find page 79 of the 2013 Cablevision annual report below. You can navigate through the pages in the report by either clicking on the pages listed below, or by using the keyword search tool below to find specific information within the annual report.-
 1
1 -
2
-
3
-
4
-
5
-
6
-
7
-
8
-
9
-
10
-
11
-
12
-
13
-
14
-
15
-
16
-
17
-
18
-
19
-
20
-
21
-
22
-
23
-
24
-
25
-
26
-
27
-
28
-
29
-
30
-
31
-
32
-
33
-
34
-
35
-
36
-
37
-
38
-
39
-
40
-
41
-
42
-
43
-
44
-
45
-
46
-
47
-
48
-
49
-
50
-
51
-
52
-
53
-
54
-
55
-
56
-
57
-
58
-
59
-
60
-
61
-
62
-
63
-
64
-
65
-
66
-
67
-
68
-
 69
69 -
 70
70 -
 71
71 -
 72
72 -
 73
73 -
 74
74 -
 75
75 -
 76
76 -
 77
77 -
 78
78 -
 79
79 -
 80
80 -
 81
81 -
 82
82 -
 83
83 -
 84
84 -
 85
85 -
 86
86 -
 87
87 -
 88
88 -
 89
89 -
90
-
91
-
92
-
93
-
94
-
95
-
96
-
97
-
98
-
99
-
100
-
101
-
102
-
103
-
104
-
105
-
106
-
107
-
108
-
109
-
110
-
111
-
112
-
113
-
114
-
115
-
116
-
117
-
118
-
119
-
120
-
121
-
122
-
123
-
124
-
125
-
126
-
127
-
128
-
129
-
130
-
131
-
132
-
133
-
134
-
135
-
136
-
137
-
138
-
139
-
140
-
141
-
142
-
143
-
144
-
145
-
146
-
147
-
148
-
149
-
150
-
151
-
152
-
153
-
154
-
155
-
156
-
157
-
158
-
159
-
160
-
161
-
162
-
163
-
164
-
165
-
166
-
167
-
168
-
169
-
170
-
171
-
172
-
173
-
174
-
175
-
176
-
177
-
178
-
179
-
180
-
181
-
182
-
183
-
184
-
185
-
186
-
187
-
188
-
189
-
190
-
191
-
192
-
193
-
194
-
195
-
196
 |
 |
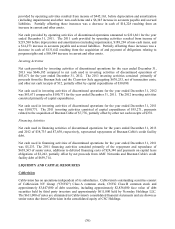
(73)
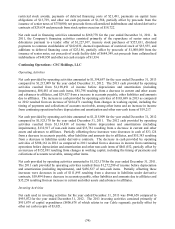
Net cash provided by operating activities amounted to $1,061,208 for the year ended December 31, 2012
compared to $1,305,182 for the year ended December 31, 2011. The 2012 cash provided by operating
activities resulted from $982,100 of income before depreciation and amortization (including impairments)
and $170,681 of non-cash items. Partially offsetting these increases were decreases in cash of $55,383
resulting from a decrease in liabilities under derivative contracts, a $28,974 increase in current and other
assets and advances to affiliates and a $7,216 decrease in accounts payable, other liabilities and amounts
due to affiliates. The decrease in cash provided by operating activities of $243,974 in 2012 as compared
to 2011 resulted from a decrease in income from continuing operations before depreciation and
amortization and other non-cash items of $362,777, partially offset by an increase of $118,803 resulting
from changes in working capital, including the timing of payments and collections of accounts receivable,
among other items.
Net cash provided by operating activities amounted to $1,305,182 for the year ended December 31, 2011.
The 2011 cash provided by operating activities resulted from $1,137,860 of income before depreciation
and amortization (including impairments) and $377,698 of non-cash items. Partially offsetting these
increases were decreases in cash of $111,895 resulting from a decrease in liabilities under derivative
contracts, a $67,786 decrease in accounts payable, other liabilities and amounts due to affiliates and a
$30,695 increase in current and other assets and advances to affiliates.
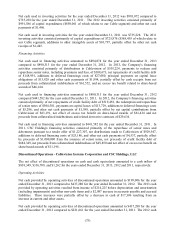
Investing Activities
Net cash used in investing activities for the year ended December 31, 2013 was $948,658 compared to
$993,072 for the year ended December 31, 2012. The 2013 investing activities consisted primarily of
$951,679 of capital expenditures ($806,678 of which relates to our Cable segment), partially offset by
other net cash receipts of $3,021.
Net cash used in investing activities for the year ended December 31, 2012 was $993,072 compared to
$735,228 for the year ended December 31, 2011. The 2012 investing activities consisted primarily of
$991,586 of capital expenditures ($850,061 of which relates to our Cable segment) and other net cash
payments of $1,486.
Net cash used in investing activities for the year ended December 31, 2011 was $735,228. The 2011
investing activities consisted primarily of capital expenditures of $725,876 ($568,458 of which relate to
our Cable segment), additions to other intangible assets of $10,797, partially offset by other net cash
receipts of $1,445.
Financing Activities
Net cash used in financing activities amounted to $655,054 for the year ended December 31, 2013
compared to $661,539 for the year ended December 31, 2012. In 2013, the Company's financing
activities consisted primarily of payments to redeem and repurchase senior notes, including premiums and
fees, of $371,498, dividend payments to common stockholders of $159,709, net repayments of credit
facility debt of $148,991, additions to deferred financings costs of $27,080, payments of $12,262 related
to the net share settlement of restricted stock awards, principal payments on capital lease obligations of
$13,828, other net cash payments of $2,638, partially offset by cash receipts from net proceeds from
collateralized indebtedness of $61,552, proceeds from stock option exercises of $18,120 and an excess tax
benefit related to share-based awards of $1,280.
Net cash used in financing activities amounted to $661,539 for the year ended December 31, 2012
compared to $269,778 for the year ended December 31, 2011. In 2012, the Company's financing
activities consisted primarily of the redemption and repurchase of senior notes of $531,326, net
repayments of credit facility debt of $519,458, treasury stock purchases of $188,600, dividend payments
to common stockholders of $163,872, payments of $19,831 resulting from the net share settlement of