Cablevision 2013 Annual Report Download - page 71
Download and view the complete annual report
Please find page 71 of the 2013 Cablevision annual report below. You can navigate through the pages in the report by either clicking on the pages listed below, or by using the keyword search tool below to find specific information within the annual report.-
 1
1 -
2
-
3
-
4
-
5
-
6
-
7
-
8
-
9
-
10
-
11
-
12
-
13
-
14
-
15
-
16
-
17
-
18
-
19
-
20
-
21
-
22
-
23
-
24
-
25
-
26
-
27
-
28
-
29
-
30
-
31
-
32
-
33
-
34
-
35
-
36
-
37
-
38
-
39
-
40
-
41
-
42
-
43
-
44
-
45
-
46
-
47
-
48
-
49
-
50
-
51
-
52
-
53
-
54
-
55
-
56
-
57
-
58
-
59
-
60
-
 61
61 -
 62
62 -
 63
63 -
 64
64 -
 65
65 -
 66
66 -
 67
67 -
 68
68 -
 69
69 -
 70
70 -
 71
71 -
 72
72 -
 73
73 -
 74
74 -
 75
75 -
 76
76 -
 77
77 -
 78
78 -
 79
79 -
 80
80 -
 81
81 -
82
-
83
-
84
-
85
-
86
-
87
-
88
-
89
-
90
-
91
-
92
-
93
-
94
-
95
-
96
-
97
-
98
-
99
-
100
-
101
-
102
-
103
-
104
-
105
-
106
-
107
-
108
-
109
-
110
-
111
-
112
-
113
-
114
-
115
-
116
-
117
-
118
-
119
-
120
-
121
-
122
-
123
-
124
-
125
-
126
-
127
-
128
-
129
-
130
-
131
-
132
-
133
-
134
-
135
-
136
-
137
-
138
-
139
-
140
-
141
-
142
-
143
-
144
-
145
-
146
-
147
-
148
-
149
-
150
-
151
-
152
-
153
-
154
-
155
-
156
-
157
-
158
-
159
-
160
-
161
-
162
-
163
-
164
-
165
-
166
-
167
-
168
-
169
-
170
-
171
-
172
-
173
-
174
-
175
-
176
-
177
-
178
-
179
-
180
-
181
-
182
-
183
-
184
-
185
-
186
-
187
-
188
-
189
-
190
-
191
-
192
-
193
-
194
-
195
-
196
 |
 |

(65)
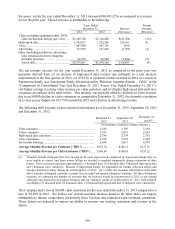
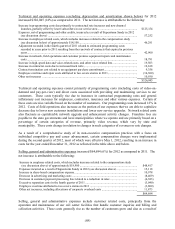
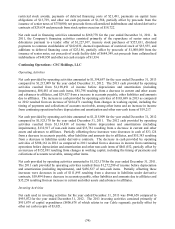
Business Segments Results
Cable
The table below sets forth, for the periods presented, certain historical financial information and the
percentage that those items bear to revenues, net for our Cable segment:
Years Ended December 31,
2012 2011
Amount
% of Net
Revenues
Amount
% of Net
Revenues
Favorable
(Unfavorable)
Revenues, net .................
.
$5,479,108 100% $5,516,548
100%
$ (37,440)
Technical and operating
expenses (excluding
depreciation and
amortization shown
below) ........................
.
2,645,835 48 2,319,790
42
(326,045)
Selling, general and
administrative
expenses .....................
.
1,073,589 20 1,008,895
18
(64,694)
Depreciation and
amortization ................
.
742,681 14 697,553
13
(45,128)
Operating income........
.
$1,017,003 19% $1,490,310
27%
$(473,307)
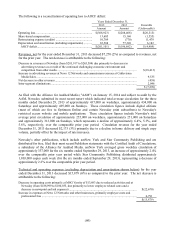
The following is a reconciliation of operating income to AOCF:
Years Ended December 31,
2012
2011
Favorable
Amount
Amount
(Unfavorable)
Operating income .................................................................. $1,017,003
$1,490,310
$(473,307)
Share-based compensation ..................................................... 38,357
27,380
10,977
Depreciation and amortization ............................................... 742,681
697,553
45,128
AOCF ............................................................................. $1,798,041
$2,215,243
$(417,202)
Superstorm Sandy
On October 29, 2012, Superstorm Sandy made landfall in our service area, resulting in widespread power
outages and service disruptions for almost 60% of our customers, as well as damage to certain portions of
our cable network.
The following table summarizes service outage credits which reduced revenues, net, incremental costs,
depreciation and capital expenditures related to Superstorm Sandy for the year ended December 31, 2012:
Revenues, net .................................................................................................................................. $ 33,156
Operating expenses:
Technical and operating expenses................................................................................................. 57,252
Selling, general and administrative expenses ................................................................................ 15,118
Impact to AOCF .............................................................................................................................. 105,526
Depreciation ................................................................................................................................ 1,462
Impact to operating income.............................................................................................................. $106,988
Capital expenditures ........................................................................................................................ $ 5,639