Cablevision 2013 Annual Report Download - page 76
Download and view the complete annual report
Please find page 76 of the 2013 Cablevision annual report below. You can navigate through the pages in the report by either clicking on the pages listed below, or by using the keyword search tool below to find specific information within the annual report.-
 1
1 -
2
-
3
-
4
-
5
-
6
-
7
-
8
-
9
-
10
-
11
-
12
-
13
-
14
-
15
-
16
-
17
-
18
-
19
-
20
-
21
-
22
-
23
-
24
-
25
-
26
-
27
-
28
-
29
-
30
-
31
-
32
-
33
-
34
-
35
-
36
-
37
-
38
-
39
-
40
-
41
-
42
-
43
-
44
-
45
-
46
-
47
-
48
-
49
-
50
-
51
-
52
-
53
-
54
-
55
-
56
-
57
-
58
-
59
-
60
-
61
-
62
-
63
-
64
-
65
-
 66
66 -
 67
67 -
 68
68 -
 69
69 -
 70
70 -
 71
71 -
 72
72 -
 73
73 -
 74
74 -
 75
75 -
 76
76 -
 77
77 -
 78
78 -
 79
79 -
 80
80 -
 81
81 -
 82
82 -
 83
83 -
 84
84 -
 85
85 -
 86
86 -
87
-
88
-
89
-
90
-
91
-
92
-
93
-
94
-
95
-
96
-
97
-
98
-
99
-
100
-
101
-
102
-
103
-
104
-
105
-
106
-
107
-
108
-
109
-
110
-
111
-
112
-
113
-
114
-
115
-
116
-
117
-
118
-
119
-
120
-
121
-
122
-
123
-
124
-
125
-
126
-
127
-
128
-
129
-
130
-
131
-
132
-
133
-
134
-
135
-
136
-
137
-
138
-
139
-
140
-
141
-
142
-
143
-
144
-
145
-
146
-
147
-
148
-
149
-
150
-
151
-
152
-
153
-
154
-
155
-
156
-
157
-
158
-
159
-
160
-
161
-
162
-
163
-
164
-
165
-
166
-
167
-
168
-
169
-
170
-
171
-
172
-
173
-
174
-
175
-
176
-
177
-
178
-
179
-
180
-
181
-
182
-
183
-
184
-
185
-
186
-
187
-
188
-
189
-
190
-
191
-
192
-
193
-
194
-
195
-
196
 |
 |

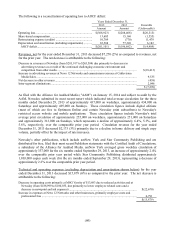
(70)
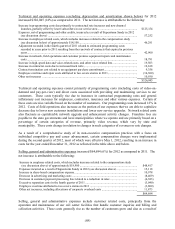
fees of $4,568 and $3,069, respectively. Technical and operating expenses consist primarily of the direct
costs associated with providing and maintaining services to our customers.
Selling, general and administrative expenses increased $2,876 (4%) for 2012 as compared to 2011. The
net increase is attributable primarily to an increase in share-based compensation expense.
Depreciation and amortization increased $5,975 (7%) for 2012 as compared to 2011. The net increase
resulted primarily from the depreciation of new asset purchases, partially offset by certain assets
becoming fully depreciated.
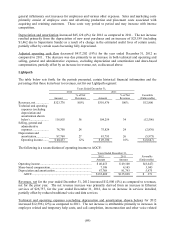
Adjusted operating cash flow increased $371 for the year ended December 31, 2012 as compared to 2011.
The increase was due primarily to an increase in revenue, net, partially offset by an increase in both
technical and operating and selling, general and administrative expenses (excluding depreciation and
amortization and share-based compensation), as discussed above.
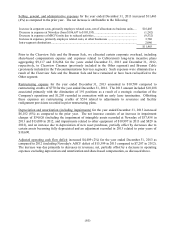
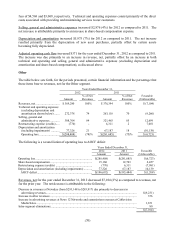
Other
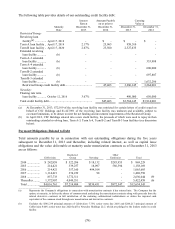
The table below sets forth, for the periods presented, certain financial information and the percentage that
those items bear to revenues, net for the Other segment.
Years Ended December 31,
2012
2011
Amount
% of Net
Revenues
Amount
% of Net
Revenues
Favorable
(Unfavorable)
Revenues, net ............................... $ 369,290 100%
$ 376,394 100% $ (7,104)
Technical and operating expenses
(excluding depreciation and
amortization shown below) ....... 272,378 74
263,118 70 (9,260)
Selling, general and
administrative expenses............. 308,764 84
321,463 85 12,699
Restructuring expense (credits) ..... (770) -
6,311 2 7,081
Depreciation and amortization
(including impairments) ........... 77,326 21
67,187 18 (10,139)
Operating loss ........................... $(288,408) (78)%
$(281,685) (75)% $ (6,723)
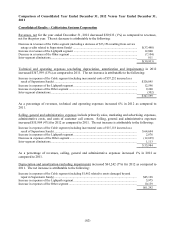
The following is a reconciliation of operating loss to AOCF deficit:
Years Ended December 31,
2012
2011
Favorable
Amount
Amount
(Unfavorable)
Operating loss ........................................................................
.
$(288,408)
$(281,685)
$(6,723)
Share-based compensation .....................................................
.
15,160
12,703
2,457
Restructuring expense (credits) ..............................................
.
(770)
6,311
(7,081)
Depreciation and amortization (including impairments) ..........
.
77,326
67,187
10,139
AOCF deficit ......................................................................
.
$(196,692)
$(195,484)
$(1,208)
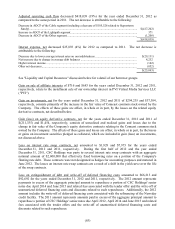
Revenues, net for the year ended December 31, 2012 decreased $7,104 (2%) as compared to revenues, net
for the prior year. The net decrease is attributable to the following:
Decrease in revenues at Newsday (from $293,148 to $283,917) due primarily to decreases in
advertising revenues..................................................................................................................... $(9,231)
Increase in other revenues ................................................................................................................ 376
Increase in advertising revenues at News 12 Networks and commission revenues at Cablevision
Media Sales ................................................................................................................................. 1,671
Intra-segment eliminations............................................................................................................... 80
$(7,104)