Cablevision 2013 Annual Report Download - page 130
Download and view the complete annual report
Please find page 130 of the 2013 Cablevision annual report below. You can navigate through the pages in the report by either clicking on the pages listed below, or by using the keyword search tool below to find specific information within the annual report.-
 1
1 -
2
-
3
-
4
-
5
-
6
-
7
-
8
-
9
-
10
-
11
-
12
-
13
-
14
-
15
-
16
-
17
-
18
-
19
-
20
-
21
-
22
-
23
-
24
-
25
-
26
-
27
-
28
-
29
-
30
-
31
-
32
-
33
-
34
-
35
-
36
-
37
-
38
-
39
-
40
-
41
-
42
-
43
-
44
-
45
-
46
-
47
-
48
-
49
-
50
-
51
-
52
-
53
-
54
-
55
-
56
-
57
-
58
-
59
-
60
-
61
-
62
-
63
-
64
-
65
-
66
-
67
-
68
-
69
-
70
-
71
-
72
-
73
-
74
-
75
-
76
-
77
-
78
-
79
-
80
-
81
-
82
-
83
-
84
-
85
-
86
-
87
-
88
-
89
-
90
-
91
-
92
-
93
-
94
-
95
-
96
-
97
-
98
-
99
-
100
-
101
-
102
-
103
-
104
-
105
-
106
-
107
-
108
-
109
-
110
-
111
-
112
-
113
-
114
-
115
-
116
-
117
-
118
-
119
-
 120
120 -
 121
121 -
 122
122 -
 123
123 -
 124
124 -
 125
125 -
 126
126 -
 127
127 -
 128
128 -
 129
129 -
 130
130 -
 131
131 -
 132
132 -
 133
133 -
 134
134 -
 135
135 -
 136
136 -
 137
137 -
 138
138 -
 139
139 -
 140
140 -
141
-
142
-
143
-
144
-
145
-
146
-
147
-
148
-
149
-
150
-
151
-
152
-
153
-
154
-
155
-
156
-
157
-
158
-
159
-
160
-
161
-
162
-
163
-
164
-
165
-
166
-
167
-
168
-
169
-
170
-
171
-
172
-
173
-
174
-
175
-
176
-
177
-
178
-
179
-
180
-
181
-
182
-
183
-
184
-
185
-
186
-
187
-
188
-
189
-
190
-
191
-
192
-
193
-
194
-
195
-
196
 |
 |

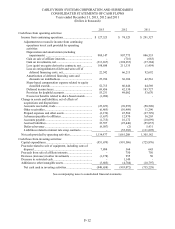
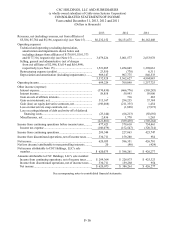
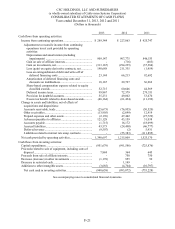
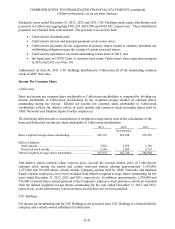
CSC HOLDINGS, LLC AND SUBSIDIARIES
(a wholly-owned subsidiary of Cablevision Systems Corporation)
CONSOLIDATED STATEMENTS OF CASH FLOWS
Years ended December 31, 2013, 2012 and 2011
(Dollars in thousands)
F-21
2013
2012
2011
Cash flows from operating activities:
Income from continuing operations ....................................
.
$ 289,344
$ 227,063
$ 425,747
Adjustments to reconcile income from continuing
operations to net cash provided by operating
activities:
Depreciation and amortization (including
impairments) ...........................................................
.
909,147
907,775
846,533
Gain on sale of affiliate interests ..................................
.
-
(716)
(683)
Gain on investments, net .............................................
.
(313,167)
(294,235)
(37,384)
Loss (gain) on equity derivative contracts, net .............
.
198,688
211,335
(1,454)
Loss on extinguishment of debt and write-off of
deferred financing costs ...........................................
.
23,144
66,213
92,692
Amortization of deferred financing costs and
discounts on indebtedness ........................................
.
18,167
29,727
36,962
Share-based compensation expense related to equity
classified awards ......................................................
.
52,715
60,646
44,569
Deferred income taxes .................................................
.
99,867
72,379
279,351
Provision for doubtful accounts ...................................
.
55,231
49,002
53,670
Excess tax benefit related to share-based awards ..........
.
(46,164)
(61,434)
(11,196)
Change in assets and liabilities, net of effects of
acquisitions and dispositions:
Accounts receivable, trade ..............................................
.
(25,673)
(76,955)
(50,520)
Other receivables ............................................................
.
(13,905)
(2,649)
12,914
Prepaid expenses and other assets ...................................
.
(2,176)
47,402
(27,729)
Advances/payables to affiliates .......................................
.
121,128
43,159
31,038
Accounts payable ...........................................................
.
(1,715)
16,172
(18,099)
Accrued liabilities...........................................................
.
43,573
(24,490)
(46,777)
Deferred revenue ............................................................
.
(9,507)
(2)
5,431
Liabilities related to interest rate swap contracts ..............
.
-
(55,383)
(111,895)
Net cash provided by operating activities ............................
.
1,398,697
1,215,009
1,523,170
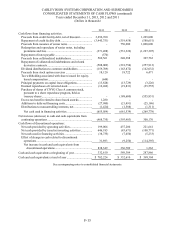
Cash flows from investing activities:
Capital expenditures...........................................................
.
(951,679)
(991,586)
(725,876)
Proceeds related to sale of equipment, including costs of
disposal ..........................................................................
.
7,884
364
645
Proceeds from sale of affiliate inter ests ...............................
.
-
750
750
Decrease (increase) in other investments ............................
.
(1,178)
955
50
Decrease in restricted cash .................................................
.
-
1,149
-
Additions to other intangible assets ....................................
.
(3,685)
(4,704)
(10,797)
Net cash used in investing activities ................................
.
(948,658)
(993,072)
(735,228)
See accompanying notes to consolidated financial statements.