Cablevision 2013 Annual Report Download - page 125
Download and view the complete annual report
Please find page 125 of the 2013 Cablevision annual report below. You can navigate through the pages in the report by either clicking on the pages listed below, or by using the keyword search tool below to find specific information within the annual report.-
 1
1 -
2
-
3
-
4
-
5
-
6
-
7
-
8
-
9
-
10
-
11
-
12
-
13
-
14
-
15
-
16
-
17
-
18
-
19
-
20
-
21
-
22
-
23
-
24
-
25
-
26
-
27
-
28
-
29
-
30
-
31
-
32
-
33
-
34
-
35
-
36
-
37
-
38
-
39
-
40
-
41
-
42
-
43
-
44
-
45
-
46
-
47
-
48
-
49
-
50
-
51
-
52
-
53
-
54
-
55
-
56
-
57
-
58
-
59
-
60
-
61
-
62
-
63
-
64
-
65
-
66
-
67
-
68
-
69
-
70
-
71
-
72
-
73
-
74
-
75
-
76
-
77
-
78
-
79
-
80
-
81
-
82
-
83
-
84
-
85
-
86
-
87
-
88
-
89
-
90
-
91
-
92
-
93
-
94
-
95
-
96
-
97
-
98
-
99
-
100
-
101
-
102
-
103
-
104
-
105
-
106
-
107
-
108
-
109
-
110
-
111
-
112
-
113
-
114
-
 115
115 -
 116
116 -
 117
117 -
 118
118 -
 119
119 -
 120
120 -
 121
121 -
 122
122 -
 123
123 -
 124
124 -
 125
125 -
 126
126 -
 127
127 -
 128
128 -
 129
129 -
 130
130 -
 131
131 -
 132
132 -
 133
133 -
 134
134 -
 135
135 -
136
-
137
-
138
-
139
-
140
-
141
-
142
-
143
-
144
-
145
-
146
-
147
-
148
-
149
-
150
-
151
-
152
-
153
-
154
-
155
-
156
-
157
-
158
-
159
-
160
-
161
-
162
-
163
-
164
-
165
-
166
-
167
-
168
-
169
-
170
-
171
-
172
-
173
-
174
-
175
-
176
-
177
-
178
-
179
-
180
-
181
-
182
-
183
-
184
-
185
-
186
-
187
-
188
-
189
-
190
-
191
-
192
-
193
-
194
-
195
-
196
 |
 |

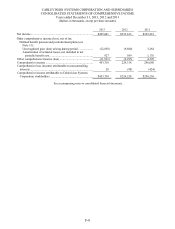
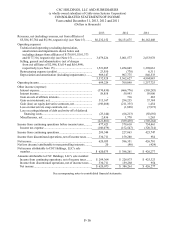
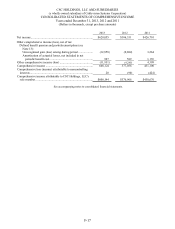
CSC HOLDINGS, LLC AND SUBSIDIARIES
(a wholly-owned subsidiary of Cablevision Systems Corporation)
CONSOLIDATED STATEMENTS OF INCOME
Years ended December 31, 2013, 2012 and 2011
(Dollars in thousands)
F-16
2013 2012 2011
Revenues, net (including revenues, net from affiliates of
$5,586, $5,784 and $5,196, respectively) (see Note 15) ........
.
$6,232,152 $6,131,675 $6,162,608
Operating expenses:
Technical and operating (excluding depreciation,
amortization and impairments shown below and
including charges from affiliates of $178,991, $181,373
and $177,316, respectively) (see Note 15) .........................
.
3,079,226 3,001,577 2,653,978
Selling, general and administrative (net of charges
from (to) affiliates of $2,986, $3,614 and $(16,994),
respectively) (see Note 15) ...............................................
.
1,521,005 1,454,045 1,398,061
Restructuring expense (credits) ............................................
.
23,550 (770) 6,311
Depreciation and amortization (including impairments) .......
.
909,147 907,775 846,533
5,532,928 5,362,627 4,904,883
Operating income ...................................................................
.
699,224 769,048 1,257,725
Other income (expense):
Interest expense ...................................................................
.
(374,430) (466,776) (503,285)
Interest income ....................................................................
.
58,858 59,993 59,900
Gain on sale of affiliate interests ..........................................
.
- 716 683
Gain on investments, net......................................................
.
313,167 294,235 37,384
Gain (loss) on equity derivative contracts, net ......................
.
(198,688) (211,335) 1,454
Loss on interest rate swap contracts, net ...............................
.
- (1,828) (7,973)
Loss on extinguishment of debt and write-off of deferred
financing costs ................................................................
.
(23,144) (66,213) (92,692)
Miscellaneous, net ...............................................................
.
2,436 1,770 1,265
(221,801) (389,438) (503,264)
Income from continuing operations before income taxes ..........
.
477,423 379,610 754,461
Income tax expense .............................................................
.
(188,079) (152,547) (328,714)
Income from continuing operations .........................................
.
289,344 227,063 425,747
Income from discontinued operations, net of income taxes.......
.
330,711 159,288 954
Net income .............................................................................
.
620,055 386,351 426,701
Net loss (income) attributable to noncontrolling interests .........
.
20 (90) (424)
Net income attributable to CSC Holdings, LLC's sole
member ...............................................................................
.
$ 620,075 $ 386,261 $ 426,277
Amounts attributable to CSC Holdings, LLC's sole member:
Income from continuing operations, net of income taxes .......
.
$ 289,364 $ 226,973 $ 425,323
Income from discontinued operations, net of income taxes....
.
330,711 159,288 954
Net income ..........................................................................
.
$ 620,075 $ 386,261 $ 426,277
See accompanying notes to consolidated financial statements.