Cablevision 2013 Annual Report Download - page 41
Download and view the complete annual report
Please find page 41 of the 2013 Cablevision annual report below. You can navigate through the pages in the report by either clicking on the pages listed below, or by using the keyword search tool below to find specific information within the annual report.-
 1
1 -
2
-
3
-
4
-
5
-
6
-
7
-
8
-
9
-
10
-
11
-
12
-
13
-
14
-
15
-
16
-
17
-
18
-
19
-
20
-
21
-
22
-
23
-
24
-
25
-
26
-
27
-
28
-
29
-
30
-
 31
31 -
 32
32 -
 33
33 -
 34
34 -
 35
35 -
 36
36 -
 37
37 -
 38
38 -
 39
39 -
 40
40 -
 41
41 -
 42
42 -
 43
43 -
 44
44 -
 45
45 -
 46
46 -
 47
47 -
 48
48 -
 49
49 -
 50
50 -
 51
51 -
52
-
53
-
54
-
55
-
56
-
57
-
58
-
59
-
60
-
61
-
62
-
63
-
64
-
65
-
66
-
67
-
68
-
69
-
70
-
71
-
72
-
73
-
74
-
75
-
76
-
77
-
78
-
79
-
80
-
81
-
82
-
83
-
84
-
85
-
86
-
87
-
88
-
89
-
90
-
91
-
92
-
93
-
94
-
95
-
96
-
97
-
98
-
99
-
100
-
101
-
102
-
103
-
104
-
105
-
106
-
107
-
108
-
109
-
110
-
111
-
112
-
113
-
114
-
115
-
116
-
117
-
118
-
119
-
120
-
121
-
122
-
123
-
124
-
125
-
126
-
127
-
128
-
129
-
130
-
131
-
132
-
133
-
134
-
135
-
136
-
137
-
138
-
139
-
140
-
141
-
142
-
143
-
144
-
145
-
146
-
147
-
148
-
149
-
150
-
151
-
152
-
153
-
154
-
155
-
156
-
157
-
158
-
159
-
160
-
161
-
162
-
163
-
164
-
165
-
166
-
167
-
168
-
169
-
170
-
171
-
172
-
173
-
174
-
175
-
176
-
177
-
178
-
179
-
180
-
181
-
182
-
183
-
184
-
185
-
186
-
187
-
188
-
189
-
190
-
191
-
192
-
193
-
194
-
195
-
196
 |
 |

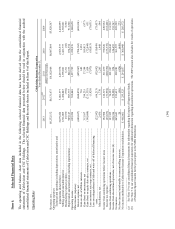
(35)
Cablevision Systems Corporation
Years Ended December 31,
2013 2012 2011
2010(a) 2009
(Dollars in thousands, except per share data)
INCOME PER SHARE:
Basic income per share attributable to Cablevision Systems
Cor
p
oration stockholders:
Income from continuing operations .......................................................... $0.49 $0.28 $1.05 $0.81 $0.45
Income from discontinued operations ....................................................... $1.30 $0.61 $0.00 $0.43 $0.53
Net income ............................................................................................. $1.79 $0.89 $1.06 $1.23 $0.98
Basic weighted average common shares (in thousands) ............................ 260,763 262,258 276,369 293,165 291,759
Diluted income per share attributable to Cablevision Systems
Cor
p
oration stockholders:
Income from continuing operations .......................................................... $0.48 $0.28 $1.02 $0.78 $0.44
Income from discontinued operations ....................................................... $1.27 $0.60 $0.00 $0.41 $0.52
Net income ............................................................................................. $1.75 $0.87 $1.02 $1.20 $0.96
Diluted weighted average common shares (in thousands).......................... 265,935 267,330 284,904 301,880 298,444
Cash dividends declared and
p
aid
p
er common share .............................. $0.60 $0.60 $0.575 $0.475 $0.40
Amounts attributable to Cablevision Systems Corporation
stockholders:
Income from continuing operations, net of income taxes ........................... $127,345 $ 74,235 $290,903 $236,293 $131,805
Income from discontinued operations, net of income taxes ....................... 338,316 159,288 954 124,655 153,767
Net income ............................................................................................. $465,661 $233,523 $291,857 $360,948 $285,572