Cablevision 2013 Annual Report Download - page 40
Download and view the complete annual report
Please find page 40 of the 2013 Cablevision annual report below. You can navigate through the pages in the report by either clicking on the pages listed below, or by using the keyword search tool below to find specific information within the annual report.-
 1
1 -
2
-
3
-
4
-
5
-
6
-
7
-
8
-
9
-
10
-
11
-
12
-
13
-
14
-
15
-
16
-
17
-
18
-
19
-
20
-
21
-
22
-
23
-
24
-
25
-
26
-
27
-
28
-
29
-
 30
30 -
 31
31 -
 32
32 -
 33
33 -
 34
34 -
 35
35 -
 36
36 -
 37
37 -
 38
38 -
 39
39 -
 40
40 -
 41
41 -
 42
42 -
 43
43 -
 44
44 -
 45
45 -
 46
46 -
 47
47 -
 48
48 -
 49
49 -
 50
50 -
51
-
52
-
53
-
54
-
55
-
56
-
57
-
58
-
59
-
60
-
61
-
62
-
63
-
64
-
65
-
66
-
67
-
68
-
69
-
70
-
71
-
72
-
73
-
74
-
75
-
76
-
77
-
78
-
79
-
80
-
81
-
82
-
83
-
84
-
85
-
86
-
87
-
88
-
89
-
90
-
91
-
92
-
93
-
94
-
95
-
96
-
97
-
98
-
99
-
100
-
101
-
102
-
103
-
104
-
105
-
106
-
107
-
108
-
109
-
110
-
111
-
112
-
113
-
114
-
115
-
116
-
117
-
118
-
119
-
120
-
121
-
122
-
123
-
124
-
125
-
126
-
127
-
128
-
129
-
130
-
131
-
132
-
133
-
134
-
135
-
136
-
137
-
138
-
139
-
140
-
141
-
142
-
143
-
144
-
145
-
146
-
147
-
148
-
149
-
150
-
151
-
152
-
153
-
154
-
155
-
156
-
157
-
158
-
159
-
160
-
161
-
162
-
163
-
164
-
165
-
166
-
167
-
168
-
169
-
170
-
171
-
172
-
173
-
174
-
175
-
176
-
177
-
178
-
179
-
180
-
181
-
182
-
183
-
184
-
185
-
186
-
187
-
188
-
189
-
190
-
191
-
192
-
193
-
194
-
195
-
196
 |
 |

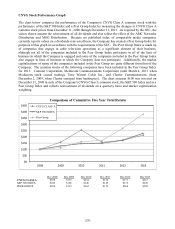
(34)
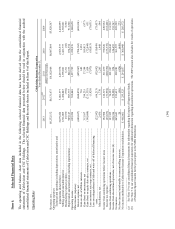
Item 6. Selected Financial Data
The operating and balance sheet data included in the following selected financial data have been derived from the consolidated financial
statements of Cablevision and CSC Holdings. The selected financial data presented below should be read in conjunction with the audited
consolidated financial statements of Cablevision and CSC Holdings and the notes thereto included in Item 8 of this Report.
Operating Data:
Cablevision Systems Corporation
Years Ended December 31,
2013
2012
(
a
)
2011 2010 2009
(Dollars in thousands)
Revenues, net.............................................................................................. $6,232,152 $6,131,675 $6,162,608 $6,087,864 $5,828,567
Operating expenses:
Technical and operating (excluding depreciation, amortization and
impairments shown below) .................................................................. 3,079,226 3,001,577 2,653,978 2,563,575 2,458,899
Selling, general and administrative .......................................................... 1,521,005 1,454,045 1,398,061 1,421,737 1,383,861
Restructuring expense (credits) ................................................................ 23,550 (770) 6,311 (58) 5,583
Depreciation and amortization (including impairments) ............................ 909,147 907,775 846,533 874,334 911,566
Operating income........................................................................................ 699,224 769,048 1,257,725 1,228,276 1,068,658
Other income (expense):
Interest expense, net ................................................................................ (600,637) (660,074) (685,967) (704,162) (669,814)
Gain on sale of affiliate interests .............................................................. - 716 683 2,051 -
Gain (loss) on investments, net ................................................................ 313,167 294,235 37,384 109,813 (977)
Gain (loss) on equity derivative contracts, net .......................................... (198,688) (211,335) 1,454 (72,044) 631
Loss on interest rate swap contracts, net ................................................... - (1,828) (7,973) (85,013) (75,631)
Loss on extinguishment of debt and write-off of deferred financing
costs.................................................................................................... (22,542) (66,213) (92,692) (110,049) (73,457)
Miscellaneous, net ................................................................................... 2,436 1,770 1,265 1,448 544
Income from continuing operations before income taxes .............................. 192,960 126,319 511,879 370,320 249,954
Income tax expense ................................................................................. (65,635) (51,994) (220,552) (133,378) (118,422)
Income from continuing operations.............................................................. 127,325 74,325 291,327 236,942 131,532
Income from discontinued operations, net of income taxes (b) ...................... 338,316 159,288 954 124,655 153,767
Net income ................................................................................................. 465,641 233,613 292,281 361,597 285,299
Net loss (income) attributable to noncontrolling interests.............................. 20 (90) (424) (649) 273
Net income attributable to Cablevision Systems Corporation stockholders .... $ 465,661 $ 233,523 $ 291,857 $ 360,948 $ 285,572
___________________________
(a) See Note 19 to our consolidated financial statements for information regarding the impact of Superstorm Sandy.
(b) See Note 5 to our consolidated financial statements for additional information regarding discontinued operations. The 2009 amount also includes the results of operations
of Madison Square Garden for the period prior to the MSG Distribution.