Cablevision 2013 Annual Report Download - page 75
Download and view the complete annual report
Please find page 75 of the 2013 Cablevision annual report below. You can navigate through the pages in the report by either clicking on the pages listed below, or by using the keyword search tool below to find specific information within the annual report.-
 1
1 -
2
-
3
-
4
-
5
-
6
-
7
-
8
-
9
-
10
-
11
-
12
-
13
-
14
-
15
-
16
-
17
-
18
-
19
-
20
-
21
-
22
-
23
-
24
-
25
-
26
-
27
-
28
-
29
-
30
-
31
-
32
-
33
-
34
-
35
-
36
-
37
-
38
-
39
-
40
-
41
-
42
-
43
-
44
-
45
-
46
-
47
-
48
-
49
-
50
-
51
-
52
-
53
-
54
-
55
-
56
-
57
-
58
-
59
-
60
-
61
-
62
-
63
-
64
-
 65
65 -
 66
66 -
 67
67 -
 68
68 -
 69
69 -
 70
70 -
 71
71 -
 72
72 -
 73
73 -
 74
74 -
 75
75 -
 76
76 -
 77
77 -
 78
78 -
 79
79 -
 80
80 -
 81
81 -
 82
82 -
 83
83 -
 84
84 -
 85
85 -
86
-
87
-
88
-
89
-
90
-
91
-
92
-
93
-
94
-
95
-
96
-
97
-
98
-
99
-
100
-
101
-
102
-
103
-
104
-
105
-
106
-
107
-
108
-
109
-
110
-
111
-
112
-
113
-
114
-
115
-
116
-
117
-
118
-
119
-
120
-
121
-
122
-
123
-
124
-
125
-
126
-
127
-
128
-
129
-
130
-
131
-
132
-
133
-
134
-
135
-
136
-
137
-
138
-
139
-
140
-
141
-
142
-
143
-
144
-
145
-
146
-
147
-
148
-
149
-
150
-
151
-
152
-
153
-
154
-
155
-
156
-
157
-
158
-
159
-
160
-
161
-
162
-
163
-
164
-
165
-
166
-
167
-
168
-
169
-
170
-
171
-
172
-
173
-
174
-
175
-
176
-
177
-
178
-
179
-
180
-
181
-
182
-
183
-
184
-
185
-
186
-
187
-
188
-
189
-
190
-
191
-
192
-
193
-
194
-
195
-
196
 |
 |

(69)
general inflationary cost increases for employees and various other expenses. Sales and marketing costs
primarily consist of employee costs and advertising production and placement costs associated with
acquiring and retaining customers. These costs vary period to period and may increase with intense
competition.
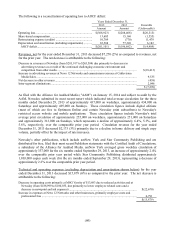
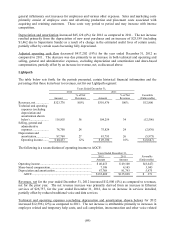
Depreciation and amortization increased $45,128 (6%) for 2012 as compared to 2011. The net increase
resulted primarily from the depreciation of new asset purchases and an increase of $23,189 (including
$1,462 due to Superstorm Sandy) as a result of a change in the estimated useful lives of certain assets,
partially offset by certain assets becoming fully depreciated.
Adjusted operating cash flow decreased $417,202 (19%) for the year ended December 31, 2012 as
compared to 2011. The decrease was due primarily to an increase in both technical and operating and
selling, general and administrative expenses, excluding depreciation and amortization and share-based
compensation, partially offset by an increase in revenue, net, as discussed above.
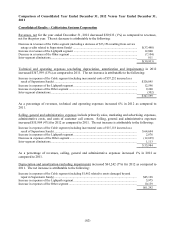
Lightpath
The table below sets forth, for the periods presented, certain historical financial information and the
percentage that those items bear to revenues, net for our Lightpath segment:
Years Ended December 31,
2012 2011
Amount
% of Net
Revenues
Amount
% of Net
Revenues
Favorable
(Unfavorable)
Revenues, net .................
.
$323,776 100% $310,976
100%
$12,800
Technical and operating
expenses (excluding
depreciation and
amortization shown
below) ........................
.
116,855 36 104,259
34
(12,596)
Selling, general and
administrative
expenses .....................
.
78,700 24 75,824
24
(2,876)
Depreciation and
amortization ................
.
87,768 27 81,793
26
(5,975)
Operating income........
.
$ 40,453 12% $ 49,100
16%
$ (8,647)
The following is a reconciliation of operating income to AOCF:
Years Ended December 31,
2012
2011
Favorable
Amount
Amount
(Unfavorable)
Operating income .................................................................. $ 40,453
$ 49,100
$(8,647)
Share-based compensation ..................................................... 7,188
4,145
3,043
Depreciation and amortization ............................................... 87,768
81,793
5,975
AOCF ............................................................................. $135,409
$135,038
$ 371
Revenues, net for the year ended December 31, 2012 increased $12,800 (4%) as compared to revenues,
net for the prior year. The net revenue increase was primarily derived from an increase in Ethernet
services of $26,757, for the year ended December 31, 2012, due to an increase in services installed,
partially offset by reduced traditional voice and data services.
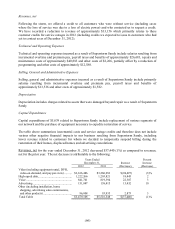
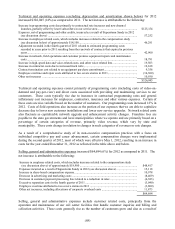
Technical and operating expenses (excluding depreciation and amortization shown below) for 2012
increased $12,596 (12%) as compared to 2011. The net increase is attributable primarily to increases in
employee related and temporary help costs, and call completion, interconnection and other voice related