Cablevision 2013 Annual Report Download - page 68
Download and view the complete annual report
Please find page 68 of the 2013 Cablevision annual report below. You can navigate through the pages in the report by either clicking on the pages listed below, or by using the keyword search tool below to find specific information within the annual report.-
 1
1 -
2
-
3
-
4
-
5
-
6
-
7
-
8
-
9
-
10
-
11
-
12
-
13
-
14
-
15
-
16
-
17
-
18
-
19
-
20
-
21
-
22
-
23
-
24
-
25
-
26
-
27
-
28
-
29
-
30
-
31
-
32
-
33
-
34
-
35
-
36
-
37
-
38
-
39
-
40
-
41
-
42
-
43
-
44
-
45
-
46
-
47
-
48
-
49
-
50
-
51
-
52
-
53
-
54
-
55
-
56
-
57
-
 58
58 -
 59
59 -
 60
60 -
 61
61 -
 62
62 -
 63
63 -
 64
64 -
 65
65 -
 66
66 -
 67
67 -
 68
68 -
 69
69 -
 70
70 -
 71
71 -
 72
72 -
 73
73 -
 74
74 -
 75
75 -
 76
76 -
 77
77 -
 78
78 -
79
-
80
-
81
-
82
-
83
-
84
-
85
-
86
-
87
-
88
-
89
-
90
-
91
-
92
-
93
-
94
-
95
-
96
-
97
-
98
-
99
-
100
-
101
-
102
-
103
-
104
-
105
-
106
-
107
-
108
-
109
-
110
-
111
-
112
-
113
-
114
-
115
-
116
-
117
-
118
-
119
-
120
-
121
-
122
-
123
-
124
-
125
-
126
-
127
-
128
-
129
-
130
-
131
-
132
-
133
-
134
-
135
-
136
-
137
-
138
-
139
-
140
-
141
-
142
-
143
-
144
-
145
-
146
-
147
-
148
-
149
-
150
-
151
-
152
-
153
-
154
-
155
-
156
-
157
-
158
-
159
-
160
-
161
-
162
-
163
-
164
-
165
-
166
-
167
-
168
-
169
-
170
-
171
-
172
-
173
-
174
-
175
-
176
-
177
-
178
-
179
-
180
-
181
-
182
-
183
-
184
-
185
-
186
-
187
-
188
-
189
-
190
-
191
-
192
-
193
-
194
-
195
-
196
 |
 |

(62)
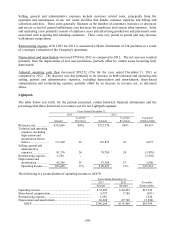
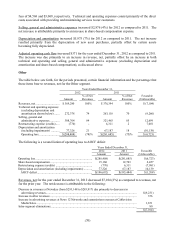
Comparison of Consolidated Year Ended December 31, 2012 Versus Year Ended December 31,
2011
Consolidated Results ± Cablevision Systems Corporation
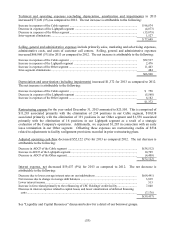
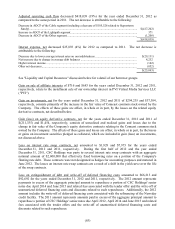
Revenues, net for the year ended December 31, 2012 decreased $30,933 (1%) as compared to revenues,
net for the prior year. The net decrease is attributable to the following:
Decrease in revenues of the Cable segment (including a decrease of $33,156 resulting from service
outage credits related to Superstorm Sandy) ..................................................................................
.
$(37,440)
Increase in revenues of the Lightpath segment .................................................................................
.
12,800
Decrease in revenues of the Other segment ......................................................................................
.
(7,104)
Inter-segment eliminations...............................................................................................................
.
811
$(30,933)
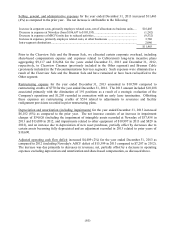
Technical and operating expenses (excluding depreciation, amortization and impairments) in 2012
increased $347,599 (13%) as compared to 2011. The net increase is attributable to the following:
Increase in expenses of the Cable segment (including incremental costs of $57,252 incurred as a
result of Superstorm Sandy) ..........................................................................................................
.
$326,045
Increase in expenses of the Lightpath segment .................................................................................
.
12,596
Increase in expenses of the Other segment .......................................................................................
.
9,260
Inter-segment eliminations...............................................................................................................
.
(302)
$347,599
As a percentage of revenues, technical and operating expenses increased 6% in 2012 as compared to
2011.
Selling, general and administrative expenses include primarily sales, marketing and advertising expenses,
administrative costs, and costs of customer call centers. Selling, general and administrative expenses
increased $55,984 (4%) for 2012 as compared to 2011. The net increase is attributable to the following:
Increase in expenses of the Cable segment (including incremental costs of $15,118 incurred as a
result of Superstorm Sandy) .......................................................................................................... $ 64,694
Increase in expenses of the Lightpath segment ................................................................................. 2,876
Decrease in expenses of the Other segment ...................................................................................... (12,699)
Inter-segment eliminations............................................................................................................... 1,113
$ 55,984
As a percentage of revenues, selling, general and administrative expenses increased 1% in 2012 as
compared to 2011.
Depreciation and amortization (including impairments) increased $61,242 (7%) for 2012 as compared to
2011. The net increase is attributable to the following:
Increase in expenses of the Cable segment (including $1,462 related to assets damaged beyond
repair in Superstorm Sandy) .......................................................................................................... $45,128
Increase in expenses of the Lightpath segment ................................................................................. 5,975
Increase in expenses of the Other segment ....................................................................................... 10,139
$61,242