Cablevision 2013 Annual Report Download - page 182
Download and view the complete annual report
Please find page 182 of the 2013 Cablevision annual report below. You can navigate through the pages in the report by either clicking on the pages listed below, or by using the keyword search tool below to find specific information within the annual report.-
 1
1 -
2
-
3
-
4
-
5
-
6
-
7
-
8
-
9
-
10
-
11
-
12
-
13
-
14
-
15
-
16
-
17
-
18
-
19
-
20
-
21
-
22
-
23
-
24
-
25
-
26
-
27
-
28
-
29
-
30
-
31
-
32
-
33
-
34
-
35
-
36
-
37
-
38
-
39
-
40
-
41
-
42
-
43
-
44
-
45
-
46
-
47
-
48
-
49
-
50
-
51
-
52
-
53
-
54
-
55
-
56
-
57
-
58
-
59
-
60
-
61
-
62
-
63
-
64
-
65
-
66
-
67
-
68
-
69
-
70
-
71
-
72
-
73
-
74
-
75
-
76
-
77
-
78
-
79
-
80
-
81
-
82
-
83
-
84
-
85
-
86
-
87
-
88
-
89
-
90
-
91
-
92
-
93
-
94
-
95
-
96
-
97
-
98
-
99
-
100
-
101
-
102
-
103
-
104
-
105
-
106
-
107
-
108
-
109
-
110
-
111
-
112
-
113
-
114
-
115
-
116
-
117
-
118
-
119
-
120
-
121
-
122
-
123
-
124
-
125
-
126
-
127
-
128
-
129
-
130
-
131
-
132
-
133
-
134
-
135
-
136
-
137
-
138
-
139
-
140
-
141
-
142
-
143
-
144
-
145
-
146
-
147
-
148
-
149
-
150
-
151
-
152
-
153
-
154
-
155
-
156
-
157
-
158
-
159
-
160
-
161
-
162
-
163
-
164
-
165
-
166
-
167
-
168
-
169
-
170
-
171
-
 172
172 -
 173
173 -
 174
174 -
 175
175 -
 176
176 -
 177
177 -
 178
178 -
 179
179 -
 180
180 -
 181
181 -
 182
182 -
 183
183 -
 184
184 -
 185
185 -
 186
186 -
 187
187 -
 188
188 -
 189
189 -
 190
190 -
 191
191 -
 192
192 -
193
-
194
-
195
-
196
 |
 |

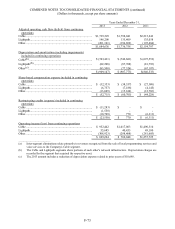
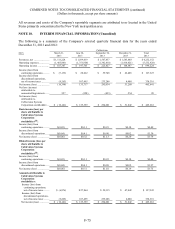
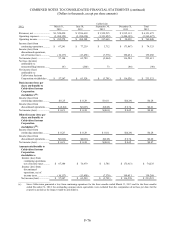
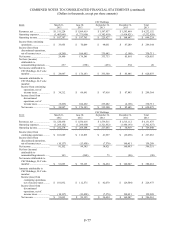
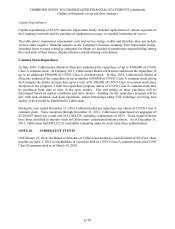
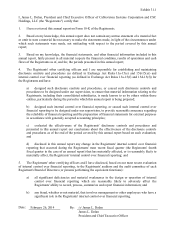
COMBINED NOTES TO CONSOLIDATED FINANCIAL STATEMENTS (continued)
(Dollars in thousands, except per share amounts)
F-73
Years Ended December 31,
2013
2012
2011
Adjusted operating cash flow (deficit) from continuing
operations
Cable ....................................................................................
.
$1,739,529
$1,798,041
$2,215,243
Lightpath...............................................................................
.
146,208
135,409
135,038
Other .....................................................................................
.
(201,101)
(196,692)
(195,484)
$1,684,636
$1,736,758
$2,154,797
Depreciation and amortization (including impairments)
included in continuing operations
Cable(b) ................................................................................
.
$ (743,431)
$ (742,681)
$ (697,553)
Lightpath(b) ..........................................................................
.
(82,208)
(87,768)
(81,793)
Other(c) .................................................................................
.
(83,508)
(77,326)
(67,187)
$ (909,147)
$ (907,775)
$(846,533)
Share-based compensation expense included in continuing
operations
Cable ....................................................................................
.
$ (32,353)
$ (38,357)
$ (27,380)
Lightpath...............................................................................
.
(6,757)
(7,188)
(4,145)
Other .....................................................................................
.
(13,605)
(15,160)
(12,703)
$ (52,715)
$ (60,705)
$ (44,228)
Restructuring credits (expense) included in continuing
operations
Cable ....................................................................................
.
$ (11,283)
$ -
$ -
Lightpath...............................................................................
.
(1,558)
-
-
Other .....................................................................................
.
(10,709)
770
(6,311)
$ (23,550)
$ 770
$ (6,311)
Operating income (loss) from continuing operations
Cable ....................................................................................
.
$ 952,462
$1,017,003
$1,490,310
Lightpath...............................................................................
.
55,685
40,453
49,100
Other .....................................................................................
.
(308,923)
(288,408)
(281,685)
$ 699,224
$ 769,048
$1,257,725
___________________________
(a) Inter-segment eliminations relate primarily to revenues recognized from the sale of local programming services and
voice services to the Company's Cable segment.
(b) The Cable and Lightpath segments share portions of each other's network infrastructure. Depreciation charges are
recorded by the segment that acquired the respective asset.
(c) The 2013 amount includes a reduction of depreciation expense related to prior years of $10,690.