Cablevision 2013 Annual Report Download - page 39
Download and view the complete annual report
Please find page 39 of the 2013 Cablevision annual report below. You can navigate through the pages in the report by either clicking on the pages listed below, or by using the keyword search tool below to find specific information within the annual report.-
 1
1 -
2
-
3
-
4
-
5
-
6
-
7
-
8
-
9
-
10
-
11
-
12
-
13
-
14
-
15
-
16
-
17
-
18
-
19
-
20
-
21
-
22
-
23
-
24
-
25
-
26
-
27
-
28
-
 29
29 -
 30
30 -
 31
31 -
 32
32 -
 33
33 -
 34
34 -
 35
35 -
 36
36 -
 37
37 -
 38
38 -
 39
39 -
 40
40 -
 41
41 -
 42
42 -
 43
43 -
 44
44 -
 45
45 -
 46
46 -
 47
47 -
 48
48 -
 49
49 -
50
-
51
-
52
-
53
-
54
-
55
-
56
-
57
-
58
-
59
-
60
-
61
-
62
-
63
-
64
-
65
-
66
-
67
-
68
-
69
-
70
-
71
-
72
-
73
-
74
-
75
-
76
-
77
-
78
-
79
-
80
-
81
-
82
-
83
-
84
-
85
-
86
-
87
-
88
-
89
-
90
-
91
-
92
-
93
-
94
-
95
-
96
-
97
-
98
-
99
-
100
-
101
-
102
-
103
-
104
-
105
-
106
-
107
-
108
-
109
-
110
-
111
-
112
-
113
-
114
-
115
-
116
-
117
-
118
-
119
-
120
-
121
-
122
-
123
-
124
-
125
-
126
-
127
-
128
-
129
-
130
-
131
-
132
-
133
-
134
-
135
-
136
-
137
-
138
-
139
-
140
-
141
-
142
-
143
-
144
-
145
-
146
-
147
-
148
-
149
-
150
-
151
-
152
-
153
-
154
-
155
-
156
-
157
-
158
-
159
-
160
-
161
-
162
-
163
-
164
-
165
-
166
-
167
-
168
-
169
-
170
-
171
-
172
-
173
-
174
-
175
-
176
-
177
-
178
-
179
-
180
-
181
-
182
-
183
-
184
-
185
-
186
-
187
-
188
-
189
-
190
-
191
-
192
-
193
-
194
-
195
-
196
 |
 |
(33)
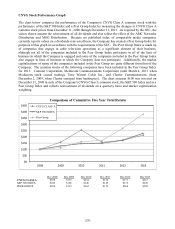
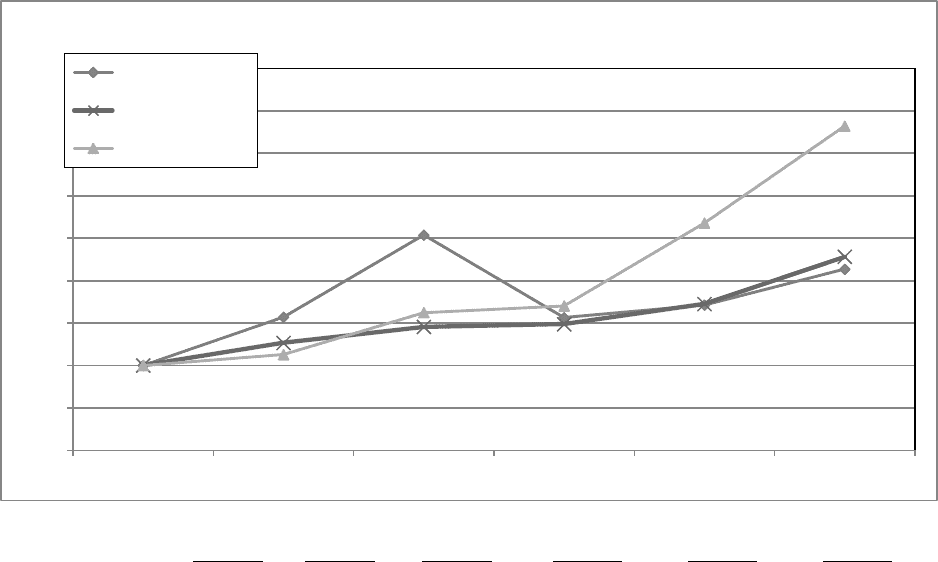
CNYG Stock Performance Graph
The chart below compares the performance of the Company's CNYG Class A common stock with the
performance of the S&P 500 Index and a Peer Group Index by measuring the changes in CNYG Class A
common stock prices from December 31, 2008 through December 31, 2013. As required by the SEC, the
values shown assume the reinvestment of all dividends and also reflect the effect of the AMC Networks
Distribution and MSG Distribution. Because no published index of comparable media companies
currently reports values on a dividends-reinvested basis, the Company has created a Peer Group Index for
purposes of this graph in accordance with the requirements of the SEC. The Peer Group Index is made up
of companies that engage in cable television operations as a significant element of their business,
although not all of the companies included in the Peer Group Index participate in all of the lines of
business in which the Company is engaged and some of the companies included in the Peer Group Index
also engage in lines of business in which the Company does not participate. Additionally, the market
capitalizations of many of the companies included in the Peer Group are quite different from that of the
Company. The common stocks of the following companies have been included in the Peer Group Index
for 2013: Comcast Corporation, Mediacom Communications Corporation (until March 4, 2011 when
Mediacom stock ceased trading), Time Warner Cable Inc., and Charter Communications (from
December 2, 2009, when Charter emerged from bankruptcy). The chart assumes $100 was invested on
December 31, 2008 in each of the Company's CNYG Class A common stock, the S&P 500 Index and in a
Peer Group Index and reflects reinvestment of dividends on a quarterly basis and market capitalization
weighting.
$0
$50
$100
$150
$200
$250
$300
$350
$400
$450
2008 2009 2010 2011 2012 2013
Comparison of Cumulative Five Year Total Return
CNYG CLASS A
S&P 500 INDEX
Peer Group
Dec 2008 Dec 2009 Dec 2010 Dec 2011 Dec 2012 Dec 2013
CNYG CLASS A $100 $157 $254 $156 $171 $213
S&P 500 INDEX $100 $126 $146 $149 $172 $228
PEER GROUP $100 $113 $162 $170 $268 $382