Cablevision 2013 Annual Report Download - page 72
Download and view the complete annual report
Please find page 72 of the 2013 Cablevision annual report below. You can navigate through the pages in the report by either clicking on the pages listed below, or by using the keyword search tool below to find specific information within the annual report.-
 1
1 -
2
-
3
-
4
-
5
-
6
-
7
-
8
-
9
-
10
-
11
-
12
-
13
-
14
-
15
-
16
-
17
-
18
-
19
-
20
-
21
-
22
-
23
-
24
-
25
-
26
-
27
-
28
-
29
-
30
-
31
-
32
-
33
-
34
-
35
-
36
-
37
-
38
-
39
-
40
-
41
-
42
-
43
-
44
-
45
-
46
-
47
-
48
-
49
-
50
-
51
-
52
-
53
-
54
-
55
-
56
-
57
-
58
-
59
-
60
-
61
-
 62
62 -
 63
63 -
 64
64 -
 65
65 -
 66
66 -
 67
67 -
 68
68 -
 69
69 -
 70
70 -
 71
71 -
 72
72 -
 73
73 -
 74
74 -
 75
75 -
 76
76 -
 77
77 -
 78
78 -
 79
79 -
 80
80 -
 81
81 -
 82
82 -
83
-
84
-
85
-
86
-
87
-
88
-
89
-
90
-
91
-
92
-
93
-
94
-
95
-
96
-
97
-
98
-
99
-
100
-
101
-
102
-
103
-
104
-
105
-
106
-
107
-
108
-
109
-
110
-
111
-
112
-
113
-
114
-
115
-
116
-
117
-
118
-
119
-
120
-
121
-
122
-
123
-
124
-
125
-
126
-
127
-
128
-
129
-
130
-
131
-
132
-
133
-
134
-
135
-
136
-
137
-
138
-
139
-
140
-
141
-
142
-
143
-
144
-
145
-
146
-
147
-
148
-
149
-
150
-
151
-
152
-
153
-
154
-
155
-
156
-
157
-
158
-
159
-
160
-
161
-
162
-
163
-
164
-
165
-
166
-
167
-
168
-
169
-
170
-
171
-
172
-
173
-
174
-
175
-
176
-
177
-
178
-
179
-
180
-
181
-
182
-
183
-
184
-
185
-
186
-
187
-
188
-
189
-
190
-
191
-
192
-
193
-
194
-
195
-
196
 |
 |

(66)
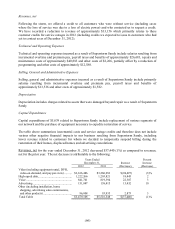
Revenues, net
Following the storm, we offered a credit to all customers who were without service (including cases
where the loss of service was due to a loss of electric power) and who contacted us to request a credit.
We have recorded a reduction to revenue of approximately $33,156 which primarily relates to these
customer credits for service outages in 2012 (including credits we expected to issue to customers who had
yet to contact us as of December 31, 2012).
Technical and Operating Expenses
Technical and operating expenses incurred as a result of Superstorm Sandy include salaries resulting from
incremental overtime and premium pay, payroll taxes and benefits of approximately $26,683, repairs and
maintenance costs of approximately $40,883 and other costs of $2,266, partially offset by a reduction of
programming and other costs of approximately $12,580.
Selling, General and Administrative Expenses
Selling, general and administrative expenses incurred as a result of Superstorm Sandy include primarily
salaries resulting from incremental overtime and premium pay, payroll taxes and benefits of
approximately $13,536 and other costs of approximately $1,582.
Depreciation
Depreciation includes charges related to assets that were damaged beyond repair as a result of Superstorm
Sandy.
Capital Expenditures
Capital expenditures of $5,639 related to Superstorm Sandy include replacement of various segments of
our network and the purchase of equipment necessary to expedite restoration of service.
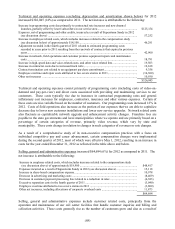
The table above summarizes incremental costs and service outage credits and therefore does not include
various other negative financial impacts to our business resulting from Superstorm Sandy, including
lower revenue related to customers for whom we decided to temporarily suspend billing during the
restoration of their homes, displaced homes and advertising cancelations.
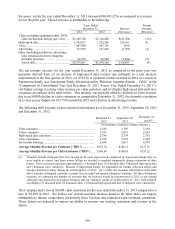
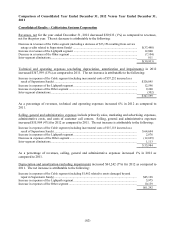
Revenues, net for the year ended December 31, 2012 decreased $37,440 (1%) as compared to revenues,
net for the prior year. The net decrease is attributable to the following:
Years Ended
December 31, Increase
Percent
Increase
2012
2011 (Decrease) (Decrease)
Video (including equipment rental, DVR,
video-on-demand, and pay-per-view) .........
.
$3,166,486
$3,260,983 $(94,497) (3)%
High-speed data...........................................
.
1,222,266
1,203,821 18,445 2
Voice ..........................................................
.
841,701
819,394 22,307 3
Advertising .................................................
.
151,847
138,415 13,432 10
Other (including installation, home
shopping, advertising sales commissions,
and other products) ....................................
.
96,808
93,935 2,873 3
Total Cable $5,479,108
$5,516,548 $(37,440) (1)%