Cablevision 2013 Annual Report Download - page 122
Download and view the complete annual report
Please find page 122 of the 2013 Cablevision annual report below. You can navigate through the pages in the report by either clicking on the pages listed below, or by using the keyword search tool below to find specific information within the annual report.-
 1
1 -
2
-
3
-
4
-
5
-
6
-
7
-
8
-
9
-
10
-
11
-
12
-
13
-
14
-
15
-
16
-
17
-
18
-
19
-
20
-
21
-
22
-
23
-
24
-
25
-
26
-
27
-
28
-
29
-
30
-
31
-
32
-
33
-
34
-
35
-
36
-
37
-
38
-
39
-
40
-
41
-
42
-
43
-
44
-
45
-
46
-
47
-
48
-
49
-
50
-
51
-
52
-
53
-
54
-
55
-
56
-
57
-
58
-
59
-
60
-
61
-
62
-
63
-
64
-
65
-
66
-
67
-
68
-
69
-
70
-
71
-
72
-
73
-
74
-
75
-
76
-
77
-
78
-
79
-
80
-
81
-
82
-
83
-
84
-
85
-
86
-
87
-
88
-
89
-
90
-
91
-
92
-
93
-
94
-
95
-
96
-
97
-
98
-
99
-
100
-
101
-
102
-
103
-
104
-
105
-
106
-
107
-
108
-
109
-
110
-
111
-
 112
112 -
 113
113 -
 114
114 -
 115
115 -
 116
116 -
 117
117 -
 118
118 -
 119
119 -
 120
120 -
 121
121 -
 122
122 -
 123
123 -
 124
124 -
 125
125 -
 126
126 -
 127
127 -
 128
128 -
 129
129 -
 130
130 -
 131
131 -
 132
132 -
133
-
134
-
135
-
136
-
137
-
138
-
139
-
140
-
141
-
142
-
143
-
144
-
145
-
146
-
147
-
148
-
149
-
150
-
151
-
152
-
153
-
154
-
155
-
156
-
157
-
158
-
159
-
160
-
161
-
162
-
163
-
164
-
165
-
166
-
167
-
168
-
169
-
170
-
171
-
172
-
173
-
174
-
175
-
176
-
177
-
178
-
179
-
180
-
181
-
182
-
183
-
184
-
185
-
186
-
187
-
188
-
189
-
190
-
191
-
192
-
193
-
194
-
195
-
196
 |
 |

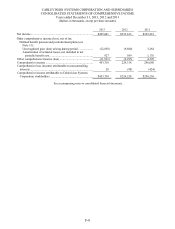
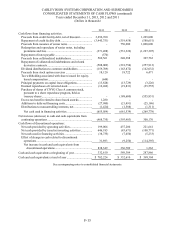
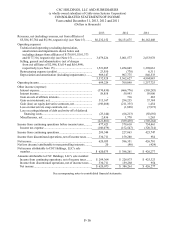
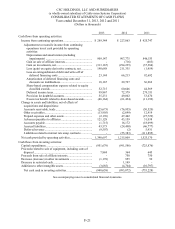
CABLEVISION SYSTEMS CORPORATION AND SUBSIDIARIES
CONSOLIDATED STATEMENTS OF CASH FLOWS (continued)
Years ended December 31, 2013, 2012 and 2011
(Dollars in thousands)
F-13
2013 2012 2011
Cash flows from financing activities:
Proceeds from credit facility debt, net of discount ...............
.
3,296,760 - 1,265,000
Repayment of credit facility debt ........................................
.
(3,445,751) (519,458) (580,651)
Proceeds from issuance of senior notes ...............................
.
- 750,000 1,000,000
Redemption and repurchase of senior notes, including
premiums and fees ..........................................................
.
(371,498) (531,326) (1,227,307)
Repayment of notes payable ...............................................
.
(570) - -
Proceeds from collateralized indebtedness ..........................
.
569,561 248,388 307,763
Repayment of collateralized indebtedness and related
derivative contracts .........................................................
.
(508,009) (218,754) (257,913)
Dividend distributions to common stockholders ..................
.
(159,709) (163,872) (162,032)
Proceeds from stock option exercises .................................
.
18,120 18,722 6,471
Tax withholding associated with shares issued for equity-
based compensation ........................................................
.
(644) - -
Principal payments on capital lease obligation s ...................
.
(13,828) (13,729) (3,226)
Deemed repurchases of restricted stock ..............................
.
(12,262) (19,831) (35,555)
Purchase of shares of CNYG Class A common stock,
pursuant to a share repurchase program, held as
treasury shares ................................................................
.
- (188,600) (555,831)
Excess tax benefit related to share-based awards .................
.
1,280 - -
Additions to deferred financing costs ..................................
.
(27,080) (21,491) (25,186)
Distributions to noncontrolling interests, net .......................
.
(1,424) (1,588) (1,311)
Net cash used in financing activities ................................
.
(655,054) (661,539) (269,778)
Net increase (decrease) in cash and cash equivalents from
continuing operations .........................................................
.
(468,735) (593,403) 300,176
Cash flows of discontinued operations:
Net cash provided by operating activities ............................
.
199,006 437,280 221,661
Net cash provided by (used in) investing activities ..............
.
646,185 (83,671) (100,771)
Net cash used in financing activities ...................................
.
(38,735) (7,650) (5,233)
Effect of change in cash related to discontinued
operation s .......................................................................
.
31,893 (9,250) (114,395)
Net increase in cash and cash equivalents from
discontinued operations ...............................................
.
838,349 336,709 1,262
Cash and cash equivalents at beginning of year ......................
.
332,610 589,304 287,866
Cash and cash equivalents at end of year ................................
.
$ 702,224 $ 332,610 $ 589,304
See accompanying notes to consolidated financial statements.