Cablevision 2013 Annual Report Download - page 168
Download and view the complete annual report
Please find page 168 of the 2013 Cablevision annual report below. You can navigate through the pages in the report by either clicking on the pages listed below, or by using the keyword search tool below to find specific information within the annual report.-
 1
1 -
2
-
3
-
4
-
5
-
6
-
7
-
8
-
9
-
10
-
11
-
12
-
13
-
14
-
15
-
16
-
17
-
18
-
19
-
20
-
21
-
22
-
23
-
24
-
25
-
26
-
27
-
28
-
29
-
30
-
31
-
32
-
33
-
34
-
35
-
36
-
37
-
38
-
39
-
40
-
41
-
42
-
43
-
44
-
45
-
46
-
47
-
48
-
49
-
50
-
51
-
52
-
53
-
54
-
55
-
56
-
57
-
58
-
59
-
60
-
61
-
62
-
63
-
64
-
65
-
66
-
67
-
68
-
69
-
70
-
71
-
72
-
73
-
74
-
75
-
76
-
77
-
78
-
79
-
80
-
81
-
82
-
83
-
84
-
85
-
86
-
87
-
88
-
89
-
90
-
91
-
92
-
93
-
94
-
95
-
96
-
97
-
98
-
99
-
100
-
101
-
102
-
103
-
104
-
105
-
106
-
107
-
108
-
109
-
110
-
111
-
112
-
113
-
114
-
115
-
116
-
117
-
118
-
119
-
120
-
121
-
122
-
123
-
124
-
125
-
126
-
127
-
128
-
129
-
130
-
131
-
132
-
133
-
134
-
135
-
136
-
137
-
138
-
139
-
140
-
141
-
142
-
143
-
144
-
145
-
146
-
147
-
148
-
149
-
150
-
151
-
152
-
153
-
154
-
155
-
156
-
157
-
 158
158 -
 159
159 -
 160
160 -
 161
161 -
 162
162 -
 163
163 -
 164
164 -
 165
165 -
 166
166 -
 167
167 -
 168
168 -
 169
169 -
 170
170 -
 171
171 -
 172
172 -
 173
173 -
 174
174 -
 175
175 -
 176
176 -
 177
177 -
 178
178 -
179
-
180
-
181
-
182
-
183
-
184
-
185
-
186
-
187
-
188
-
189
-
190
-
191
-
192
-
193
-
194
-
195
-
196
 |
 |

COMBINED NOTES TO CONSOLIDATED FINANCIAL STATEMENTS (continued)
(Dollars in thousands, except per share amounts)
F-59
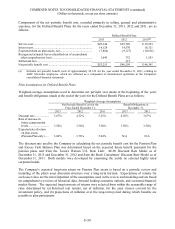
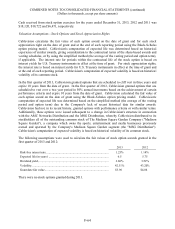
Components of the net periodic benefit cost, recorded primarily in selling, general and administrative
expenses, for the Defined Benefit Plans for the years ended December 31, 2013, 2012 and 2011, are as
follows:
Defined Benefit Plans
2013
2012
2011(a)
Service cost ...........................................................................
.
$45,346
$39,789
$ 39,253
Interest cost ...........................................................................
.
14,128
14,570
16,321
Expected return on plan assets, net .........................................
.
(7,866)
(9,127)
(10,816)
Recognized actuarial loss (reclassified out of accumulated
other comprehensive loss) ...................................................
.
1,645
752
1,583
Settlement loss ......................................................................
.
-
315
-
Net periodic benefit cost ........................................................
.
$53,253
$46,299
$ 46,341
___________________________
(a) Includes net periodic benefit costs of approximately $2,332 for the year ended December 31, 2011, relating to
AMC Networks employees, which are reflected as a component of discontinued operations in the Company's
consolidated financial statements.
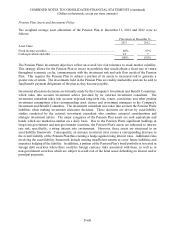
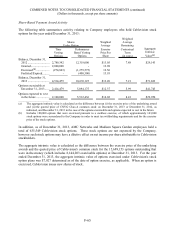
Plan Assumptions for Defined Benefit Plans
Weighted-average assumptions used to determine net periodic cost (made at the beginning of the year)
and benefit obligations (made at the end of the year) for the Defined Benefit Plans are as follows:
Weighted-Average Assumptions
Net Periodic Benefit Cost for the
Years Ended December 31,
Benefit Obligations at
December 31,
2013 2012 2011 2013 2012
Discount rate .................
.
3.67% 4.32% 5.25% 4.56% 3.67%
Rate of increase in
future compensation
levels .........................
.
3.50% 3.50% 3.50% 3.50% 3.50%
Expected rate of return
on plan assets
(Pension Plan only) ....
.
3.60% 3.76% 5.04% N/A N/A
The discount rate used by the Company in calculating the net periodic benefit cost for the Pension Plan
and Excess Cash Balance Plan was determined based on the expected future benefit payments for the
pension plans and from the Towers Watson U.S. Rate Link: 40-90 Discount Rate Model as of
December 31, 2013 and December 31, 2012 and from the Buck Consultants' Discount Rate Model as of
December 31, 2011. Both models were developed by examining the yields on selected highly rated
corporate bonds.
The Company's expected long-term return on Pension Plan assets is based on a periodic review and
modeling of the plan's asset allocation structure over a long-term horizon. Expectations of returns for
each asset class are the most important of the assumptions used in the review and modeling and are based
on comprehensive reviews of historical data, forward looking economic outlook, and economic/financial
market theory. The expected long-term rate of returns were selected from within the reasonable range of
rates determined by (a) historical real returns, net of inflation, for the asset classes covered by the
investment policy, and (b) projections of inflation over the long-term period during which benefits are
payable to plan participants.