Cablevision 2013 Annual Report Download - page 183
Download and view the complete annual report
Please find page 183 of the 2013 Cablevision annual report below. You can navigate through the pages in the report by either clicking on the pages listed below, or by using the keyword search tool below to find specific information within the annual report.-
 1
1 -
2
-
3
-
4
-
5
-
6
-
7
-
8
-
9
-
10
-
11
-
12
-
13
-
14
-
15
-
16
-
17
-
18
-
19
-
20
-
21
-
22
-
23
-
24
-
25
-
26
-
27
-
28
-
29
-
30
-
31
-
32
-
33
-
34
-
35
-
36
-
37
-
38
-
39
-
40
-
41
-
42
-
43
-
44
-
45
-
46
-
47
-
48
-
49
-
50
-
51
-
52
-
53
-
54
-
55
-
56
-
57
-
58
-
59
-
60
-
61
-
62
-
63
-
64
-
65
-
66
-
67
-
68
-
69
-
70
-
71
-
72
-
73
-
74
-
75
-
76
-
77
-
78
-
79
-
80
-
81
-
82
-
83
-
84
-
85
-
86
-
87
-
88
-
89
-
90
-
91
-
92
-
93
-
94
-
95
-
96
-
97
-
98
-
99
-
100
-
101
-
102
-
103
-
104
-
105
-
106
-
107
-
108
-
109
-
110
-
111
-
112
-
113
-
114
-
115
-
116
-
117
-
118
-
119
-
120
-
121
-
122
-
123
-
124
-
125
-
126
-
127
-
128
-
129
-
130
-
131
-
132
-
133
-
134
-
135
-
136
-
137
-
138
-
139
-
140
-
141
-
142
-
143
-
144
-
145
-
146
-
147
-
148
-
149
-
150
-
151
-
152
-
153
-
154
-
155
-
156
-
157
-
158
-
159
-
160
-
161
-
162
-
163
-
164
-
165
-
166
-
167
-
168
-
169
-
170
-
171
-
172
-
 173
173 -
 174
174 -
 175
175 -
 176
176 -
 177
177 -
 178
178 -
 179
179 -
 180
180 -
 181
181 -
 182
182 -
 183
183 -
 184
184 -
 185
185 -
 186
186 -
 187
187 -
 188
188 -
 189
189 -
 190
190 -
 191
191 -
 192
192 -
 193
193 -
194
-
195
-
196
 |
 |

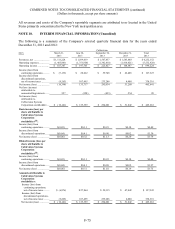
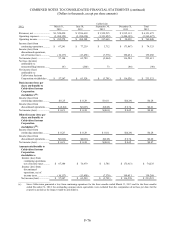
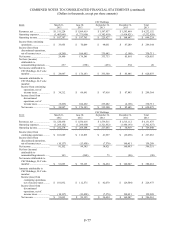
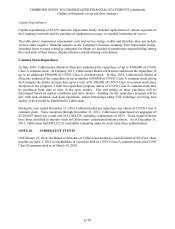
COMBINED NOTES TO CONSOLIDATED FINANCIAL STATEMENTS (continued)
(Dollars in thousands, except per share amounts)
F-74
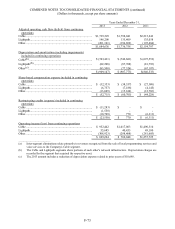
For the years ended December 31, 2013, 2012 and 2011, Cable segment revenue was derived from the
following sources:
Years Ended December 31,
2013
2012
2011
Video (including equipment rental, DVR, video-on-demand,
and pay-per-view) ................................................................
.
$3,149,702
$3,166,486
$3,260,983
High-speed data.....................................................................
.
1,342,627
1,222,266
1,203,821
Voice ....................................................................................
.
841,048
841,701
819,394
Advertising ...........................................................................
.
147,875
151,847
138,415
Other (including installation, advertising sales commissions,
home shopping, and other products) .....................................
.
94,759
96,808
93,935
$5,576,011
$5,479,108
$5,516,548
A reconciliation of reportable segment amounts to Cablevision's and CSC Holdings' consolidated
balances is as follows:
Years Ended December 31,
2013
2012
2011
Operating income for reportable segments ..............................
.
$ 699,224
$ 769,048
$1,257,725
Items excluded from operating income (loss):
CSC Holdings interest expense...........................................
.
(374,430)
(466,776)
(503,285)
CSC Holdings interest income ............................................
.
423
914
821
CSC Holdings intercompany interest income ......................
.
58,435
59,079
59,079
Gain on sale of affiliate interests ........................................
.
-
716
683
Gain on investments, net ....................................................
.
313,167
294,235
37,384
Gain (loss) on equity derivative contracts, net .....................
.
(198,688)
(211,335)
1,454
Loss on interest rate swap contracts, net .............................
.
-
(1,828)
(7,973)
Loss on extinguishment of debt and write-off of deferred
financing costs ................................................................
.
(23,144)
(66,213)
(92,692)
Miscellaneous, net .............................................................
.
2,436
1,770
1,265
CSC Holdings income from continuing operations before
income taxes ......................................................................
.
477,423
379,610
754,461
Cablevision interest expense ...............................................
.
(226,672)
(194,276)
(183,518)
Intercompany interest expense ............................................
.
(58,435)
(59,079)
(59,079)
Cablevision interest income ................................................
.
42
64
15
Loss on extinguishment of debt and write-off of deferred
financing costs, net ..........................................................
.
602
-
-
Cablevision income from continuing operations before
income taxes ......................................................................
.
$ 192,960
$ 126,319
$ 511,879
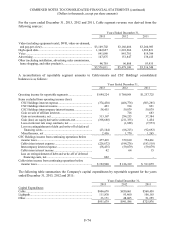
The following table summarizes the Company's capital expenditures by reportable segment for the years
ended December 31, 2013, 2012 and 2011:
Years Ended December 31,
2013
2012
2011
Capital Expenditures
Cable ....................................................................................
.
$806,678
$850,061
$568,458
Lightpath...............................................................................
.
111,830
93,460
106,163
Other .....................................................................................
.
33,171
48,065
51,255
$951,679
$991,586
$725,876