Cablevision 2013 Annual Report Download - page 52
Download and view the complete annual report
Please find page 52 of the 2013 Cablevision annual report below. You can navigate through the pages in the report by either clicking on the pages listed below, or by using the keyword search tool below to find specific information within the annual report.(46)
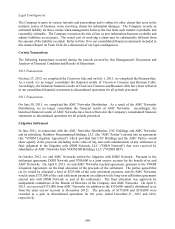
Company's cable television franchises and various reporting unit trademarks, which are valued using an
income approach or market approach. The Company's cable television franchises are the largest of the
Company's identifiable indefinite-lived intangible assets and reflect agreements we have with state and
local governments that allow us to construct and operate a cable business within a specified geographic
area. Our cable television franchises are valued using a discounted cash flows ("DCF") methodology.
The DCF methodology used to value cable television franchises entails identifying the projected discrete
cash flows related to such cable television franchises and discounting them back to the valuation date.
The projected discrete cash flows related to such cable television franchises represent the rights to solicit
and the right to service potential customers in the service areas defined by franchise rights currently held
by the Company. Significant judgments inherent in a valuation include the selection of appropriate
discount rates, estimating the amount and timing of estimated future cash flows attributable to the cable
television franchises and identification of appropriate continuing growth rate assumptions. The discount
rates used in the DCF analysis are intended to reflect the risk inherent in the projected future cash flows
generated by the respective intangible assets.
Based on the Company's annual impairment test during the first quarter of 2013, the Company's units of
accounting that represent approximately 96% of the Company's identifiable indefinite-lived intangible
assets have significant safety margins, representing the excess of the identifiable indefinite-lived
intangible assets' estimated fair value unit of accounting over their respective carrying values. In order to
evaluate the sensitivity of the fair value calculations of all the Company's identifiable indefinite-lived
intangibles, the Company applied hypothetical 10%, 20% and 30% decreases to the estimated fair value
of each of the Company's identifiable indefinite-lived intangibles. These hypothetical decreases of 10%,
20% and 30% would not have resulted in impairment charges related to any of the Company's identifiable
indefinite-lived intangible assets, except for the Newsday related trademarks. The Company recorded an
impairment charge of $25,100, $13,000 and $11,000, in the fourth quarter of 2013, 2012 and 2011,
respectively, related to these trademarks, reflecting the excess of the carrying value over the estimated fair
value.
The estimated fair values of Newsday's trademarks were based on discounted future cash flows calculated
based on the relief-from-royalty method. The reduction in estimated fair values of the trademarks under
the relief-from-royalty method was primarily due to a decrease in the assumed royalty rate from 3% for
2011 to 2% for 2012 and 0.5% for 2013. These decreases are primarily due to the lower projected
margins for the Newsday print newspaper and newsday.com. In addition, declines in the Company's
revenue projections for the Newsday print newspaper and newsday.com and changes in the discount rate
from 12.5% for 2011 to 11.5% for 2012 and 12.0% for 2013 also impacted the estimated fair values.
Changes in such estimates or the application of alternative assumptions could produce significantly
different results.
In addition, in 2013, the Company recorded an impairment charge of $12,358, relating to the excess of the
carrying value of Newsday's amortizing advertising relationships over its estimated fair value. The
decrease in fair value, which was determined based on discounted cash flows, resulted primarily from the
decline in projected cash flows related to these assets.


