Cablevision 2013 Annual Report Download - page 56
Download and view the complete annual report
Please find page 56 of the 2013 Cablevision annual report below. You can navigate through the pages in the report by either clicking on the pages listed below, or by using the keyword search tool below to find specific information within the annual report.-
 1
1 -
2
-
3
-
4
-
5
-
6
-
7
-
8
-
9
-
10
-
11
-
12
-
13
-
14
-
15
-
16
-
17
-
18
-
19
-
20
-
21
-
22
-
23
-
24
-
25
-
26
-
27
-
28
-
29
-
30
-
31
-
32
-
33
-
34
-
35
-
36
-
37
-
38
-
39
-
40
-
41
-
42
-
43
-
44
-
45
-
 46
46 -
 47
47 -
 48
48 -
 49
49 -
 50
50 -
 51
51 -
 52
52 -
 53
53 -
 54
54 -
 55
55 -
 56
56 -
 57
57 -
 58
58 -
 59
59 -
 60
60 -
 61
61 -
 62
62 -
 63
63 -
 64
64 -
 65
65 -
 66
66 -
67
-
68
-
69
-
70
-
71
-
72
-
73
-
74
-
75
-
76
-
77
-
78
-
79
-
80
-
81
-
82
-
83
-
84
-
85
-
86
-
87
-
88
-
89
-
90
-
91
-
92
-
93
-
94
-
95
-
96
-
97
-
98
-
99
-
100
-
101
-
102
-
103
-
104
-
105
-
106
-
107
-
108
-
109
-
110
-
111
-
112
-
113
-
114
-
115
-
116
-
117
-
118
-
119
-
120
-
121
-
122
-
123
-
124
-
125
-
126
-
127
-
128
-
129
-
130
-
131
-
132
-
133
-
134
-
135
-
136
-
137
-
138
-
139
-
140
-
141
-
142
-
143
-
144
-
145
-
146
-
147
-
148
-
149
-
150
-
151
-
152
-
153
-
154
-
155
-
156
-
157
-
158
-
159
-
160
-
161
-
162
-
163
-
164
-
165
-
166
-
167
-
168
-
169
-
170
-
171
-
172
-
173
-
174
-
175
-
176
-
177
-
178
-
179
-
180
-
181
-
182
-
183
-
184
-
185
-
186
-
187
-
188
-
189
-
190
-
191
-
192
-
193
-
194
-
195
-
196
 |
 |

(50)
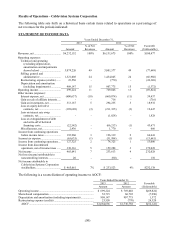
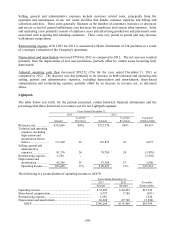
Results of Operations - Cablevision Systems Corporation
The following table sets forth on a historical basis certain items related to operations as a percentage of
net revenues for the periods indicated:
STATEMENT OF INCOME DATA
Years Ended December 31,
2013 2012
% of Net
% of Net Favorable
Amount Revenues
Amount
Revenues (Unfavorable)
Revenues, net ...................................... $6,232,152 100%
$6,131,675
100% $100,477
Operating expenses:
Technical and operating
(excluding depreciation,
amortization and impairments
shown below) .............................. 3,079,226 49
3,001,577
49 (77,649)
Selling, general and
administrative .............................. 1,521,005 24
1,454,045
24 (66,960)
Restructuring expense (credits) ....... 23,550 -
(770)
- (24,320)
Depreciation and amortization
(including impairments) .............. 909,147 15
907,775
15 (1,372)
Operating income ................................ 699,224 11
769,048
13 (69,824)
Other income (expense):
Interest expense, net ........................ (600,637) (10)
(660,074)
(11) 59,437
Gain on sale of affiliate interests ..... - -
716
- (716)
Gain on investments, net ................. 313,167 5
294,235
5 18,932
Loss on equity derivative
contracts, net................................ (198,688) (3)
(211,335)
(3) 12,647
Loss on interest rate swap
contracts, net................................ - -
(1,828)
- 1,828
Loss on extinguishment of debt
and write-off of deferred
financing costs ............................. (22,542) -
(66,213)
(1) 43,671
Miscellaneous, net ........................... 2,436 -
1,770
- 666
Income from continuing operations
before income taxes ........................ 192,960 3
126,319
2 66,641
Income tax expense ............................ (65,635) (1)
(51,994)
(1) (13,641)
Income from continuing operations .... 127,325 2
74,325
1 53,000
Income from discontinued
operations, net of income taxes ...... 338,316 5
159,288
3 179,028
Net income ......................................... 465,641 7
233,613
4 232,028
Net loss (income) attributable to
noncontrolling interests .................. 20 -
(90)
- 110
Net income attributable to
Cablevision Systems Corporation
stockholders .................................... $ 465,661 7%
$ 233,523
4% $232,138
The following is a reconciliation of operating income to AOCF:
Years Ended December 31,
2013 2012 Favorable
Amount Amount (Unfavorable)
Operating income ............................................................................
.
$ 699,224 $ 769,048 $(69,824)
Share-based compensation ..............................................................
.
52,715 60,705 (7,990)
Depreciation and amortization (including impairments) .................
.
909,147 907,775 1,372
Restructuring expense (credits) .......................................................
.
23,550 (770) 24,320
AOCF ..........................................................................................
.
$1,684,636 $1,736,758 $(52,122)